

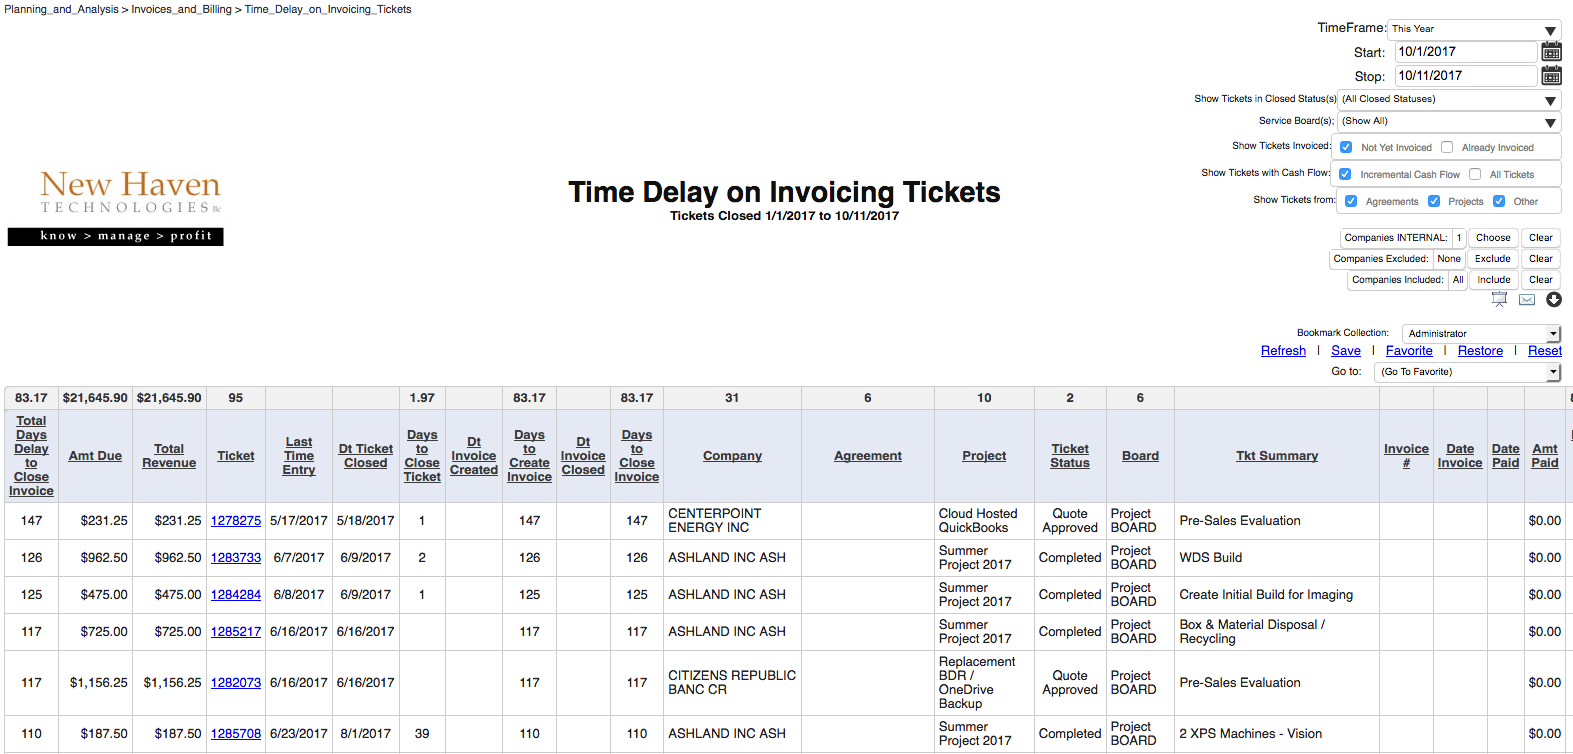
Recent updates to the Executive Briefing Service have introduced a new style of report called “Analysis Grid” reports. Analysis Grid reports are designated via the addition of “(AG)” to the end of the name of the report on the EBS menu. Analysis Grid reports allow you to customize the report to suit your own needs, and the “Bookmark” feature of EBS allows you to save those customizations as a Bookmark for one-click retrieval of your report. Here’s a quick introduction to Analysis Grid (AG) reports:
When you first open an Analysis Grid report (designated as such with “(AG)” at the end of the name of the report on the EBS menu, you’ll see data displayed in a table format. Above the report table you will see a series of buttons which allow you to customize the display of the report to your needs.
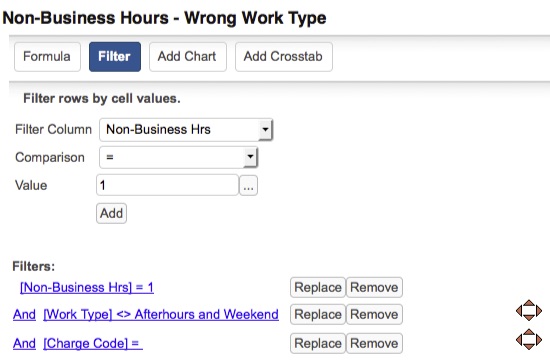
We’ll take a look at each of the Analysis Grid buttons, starting with the FILTER button (since it is the most-used):
FILTER button
The filter lets you reduce the displayed data so that you see only the records that you are interested in seeing. Click the FILTER button, select the field that you want to “filter” on, the condition and the value for the filter.
For many “Filter Column” fields, you can display the matching values to pick from by clicking the “…” button to the right of the VALUE pop-up menu.
Once you are done, click the “Add” button and your filter will be applied to the displayed data.