Love ConnectWise, but hate their reports?
Get unlimited Custom ConnectWise reports and over 300 Interactive Reports, Dashboards and SmartPhone Reports for you and your entire staff for less than $10 per day…
Do you need BETTER information to manage your MSP Practice? FASTER? More ACCURATE? Do you need to be able to VERIFY that the information in the report is CORRECT? Do you want to focus on MANAGING your MSP Practice rather than trying to figure out how to GET the information you need from the hundreds of tables and thousands of fields in the ConnectWise database? If that sounds like you, keep reading. Here’s some of our most favorite examples:
State of the Business
Start with the fundamentals of your business:
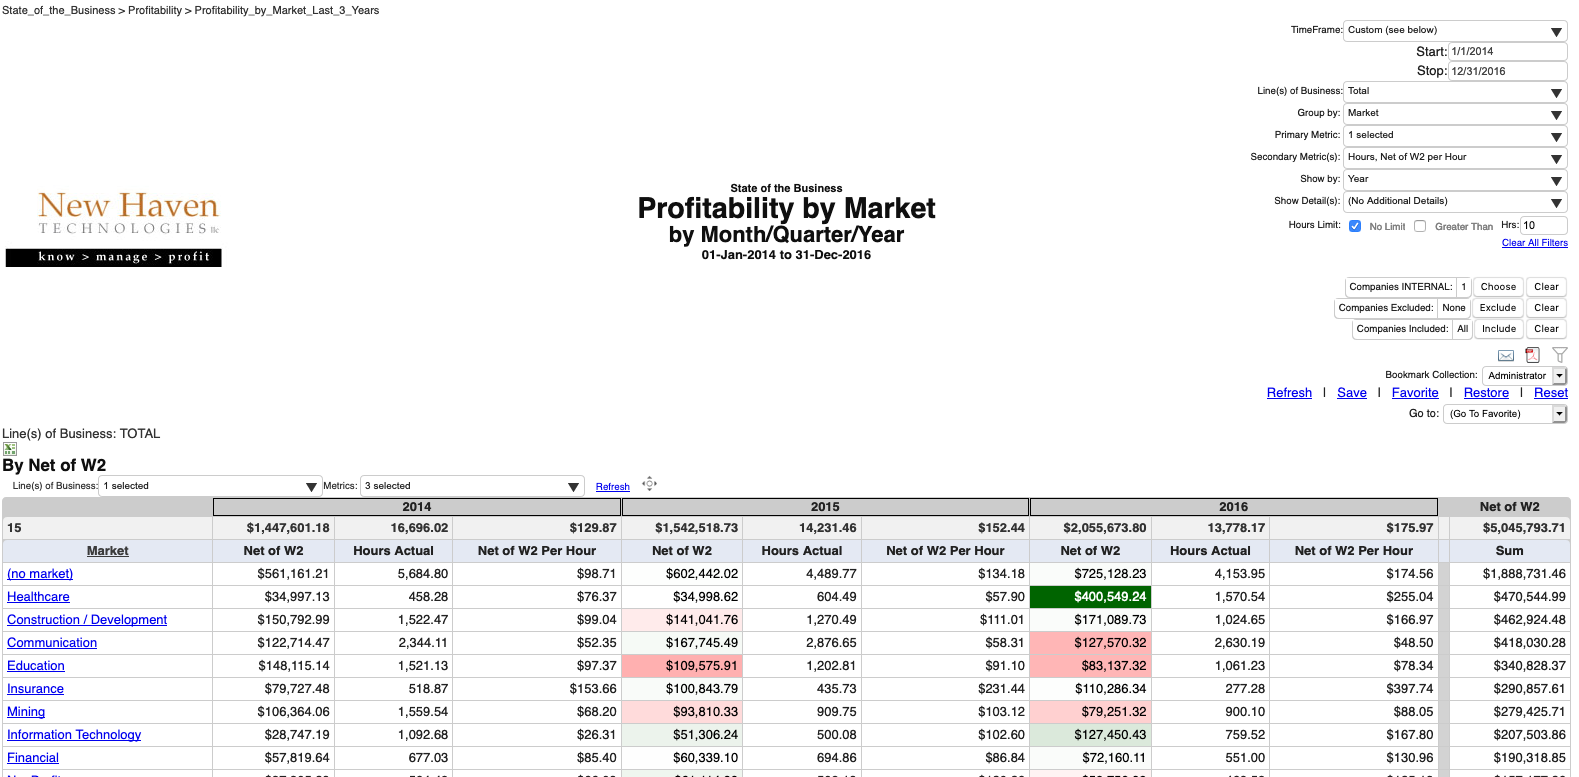
ARE YOU IN THE RIGHT MARKETS?
How much of your business is in each vertical Market? Which is most profitable? Which is most profitable ‘per hour’ that your team works? Where should you GROW your business? What Markets should you perhaps exit?
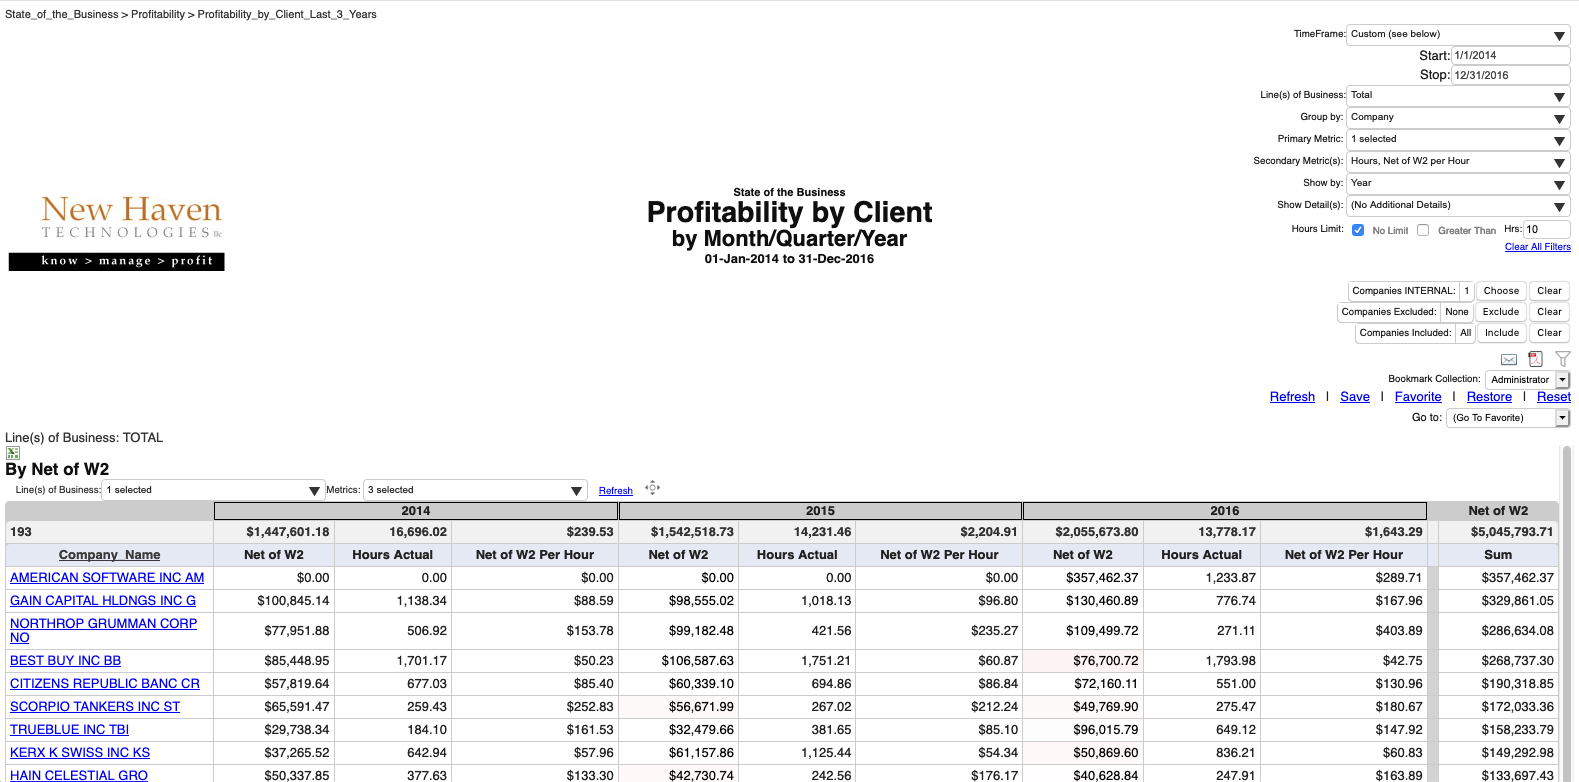
DO YOU HAVE THE RIGHT CUSTOMERS?
Industry thought-leaders like Service Leadership Inc. have found that the most successful MSPs focus on growing their business with their best customers, and terminating business relationships with poorly performing clients. Who are your BEST customers? Who are your WORST?
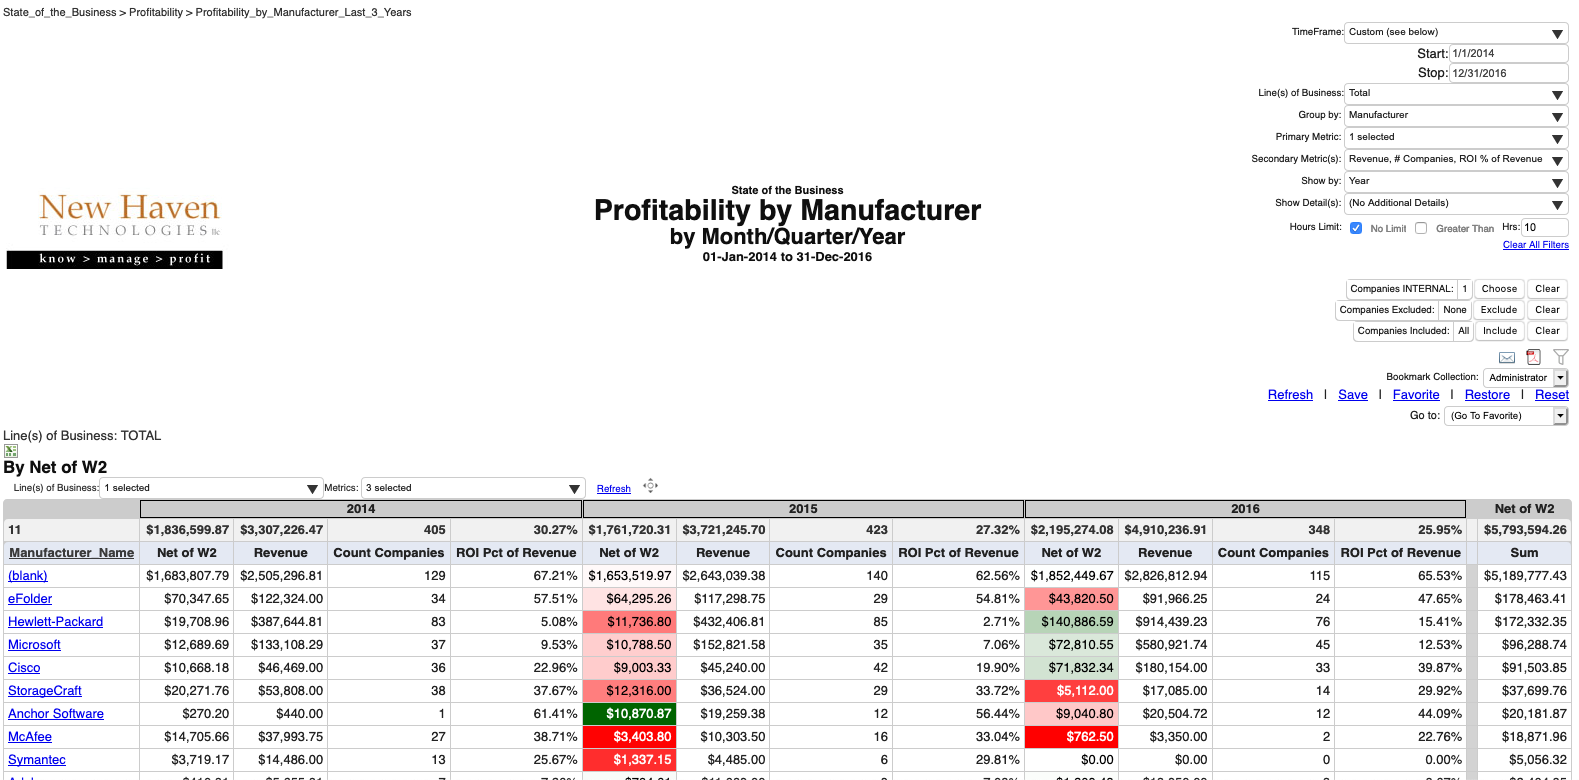
DO YOU HAVE THE RIGHT VENDOR PARTNERS?
The heart of a successful MSP Practice is driving SERVICE revenue, but we all know that some PRODUCTS ‘drag’ services along with them. So are you partnering with the right vendors, selling the right products? What’s your ROI with each vendor partner? How many clients are you selling to for each vendor?
Reports
Here’s a few examples of some of our favorite reports:
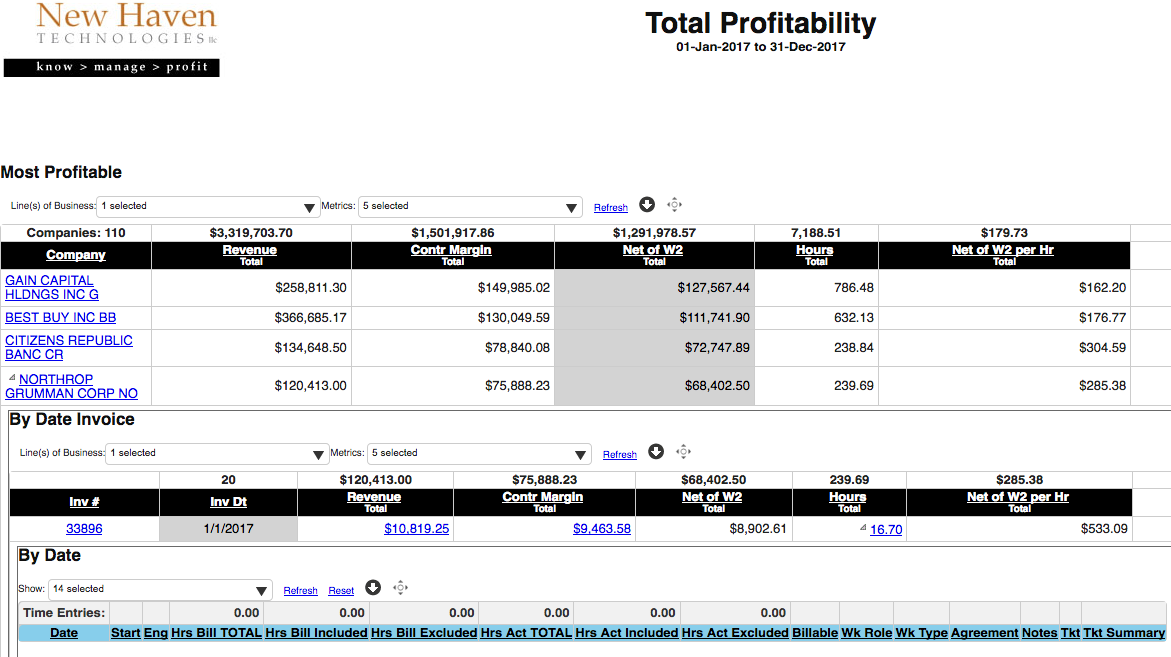
HOW’S BUSINESS?
Who are your best customers? Your worst? Which clients are you MAKING money on? (including the cost of your staff) Where are you LOSING money? Total Profitability gives you a stack-ranking of your clients from best-to-worst. Click any column header to re-sort from worst-to-best. Not sure if you’ve found a ‘business problem’ or maybe just a ‘ConnectWise data’ problem? Drill-down all the way to the invoice and time entry line-item detail in just a few clicks to see all the underlying details. Analyze your business by selecting any combination of up to 10 ‘Lines of Business’ and 30 metrics.
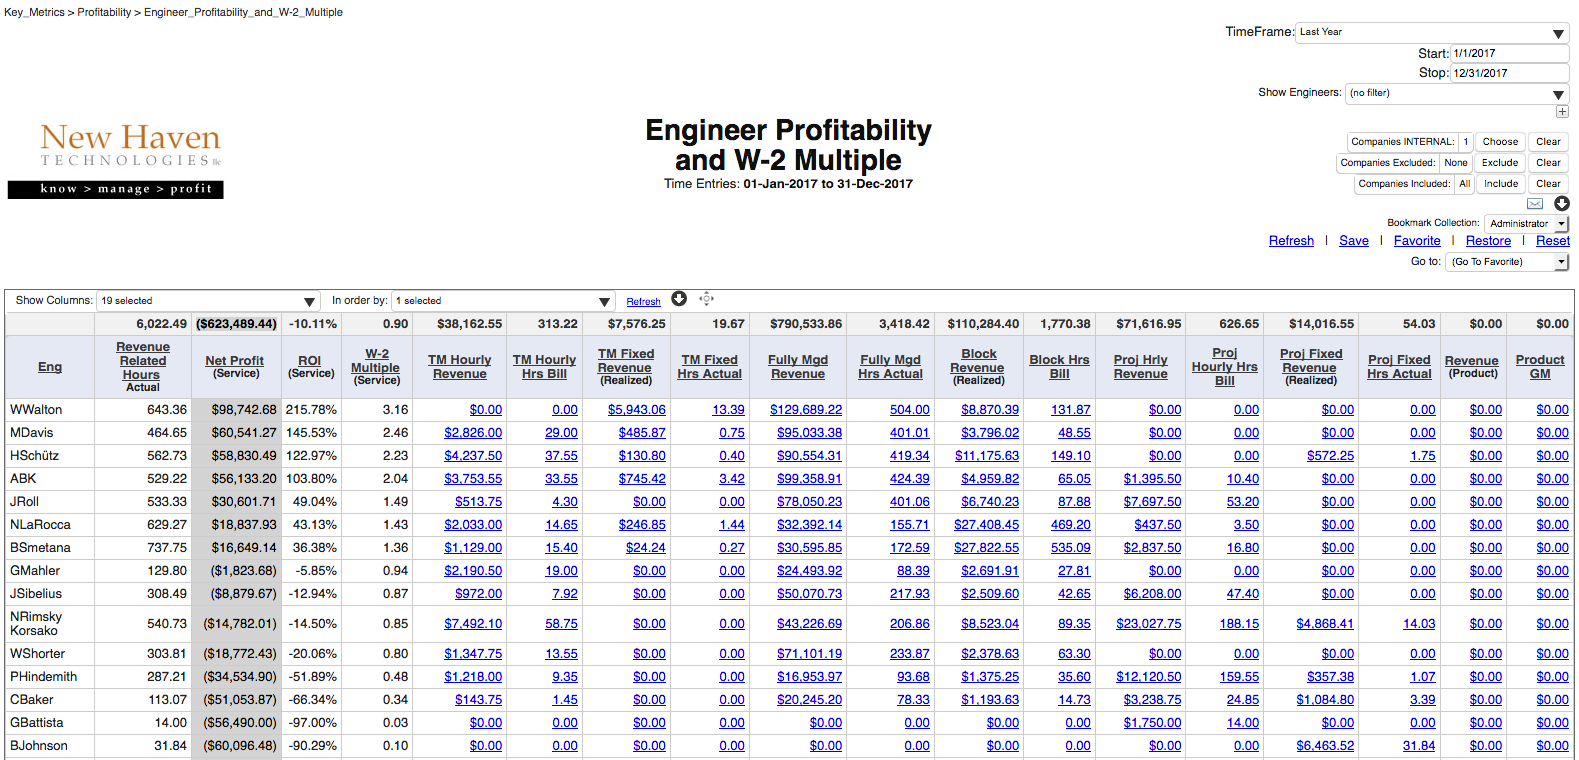
WHO IS YOUR BEST ENGINEER?
Who is your best engineer? Well, you can measure that a lot of different ways, but one way is to see which engineer is MOST PROFITABLE for you, taking into account the work that he/she is doing as well as what you are paying them. The ‘shaded’ Net Profit column (see below) shows you which engineer is most profitable for you based on the work they are doing and what you are paying them.
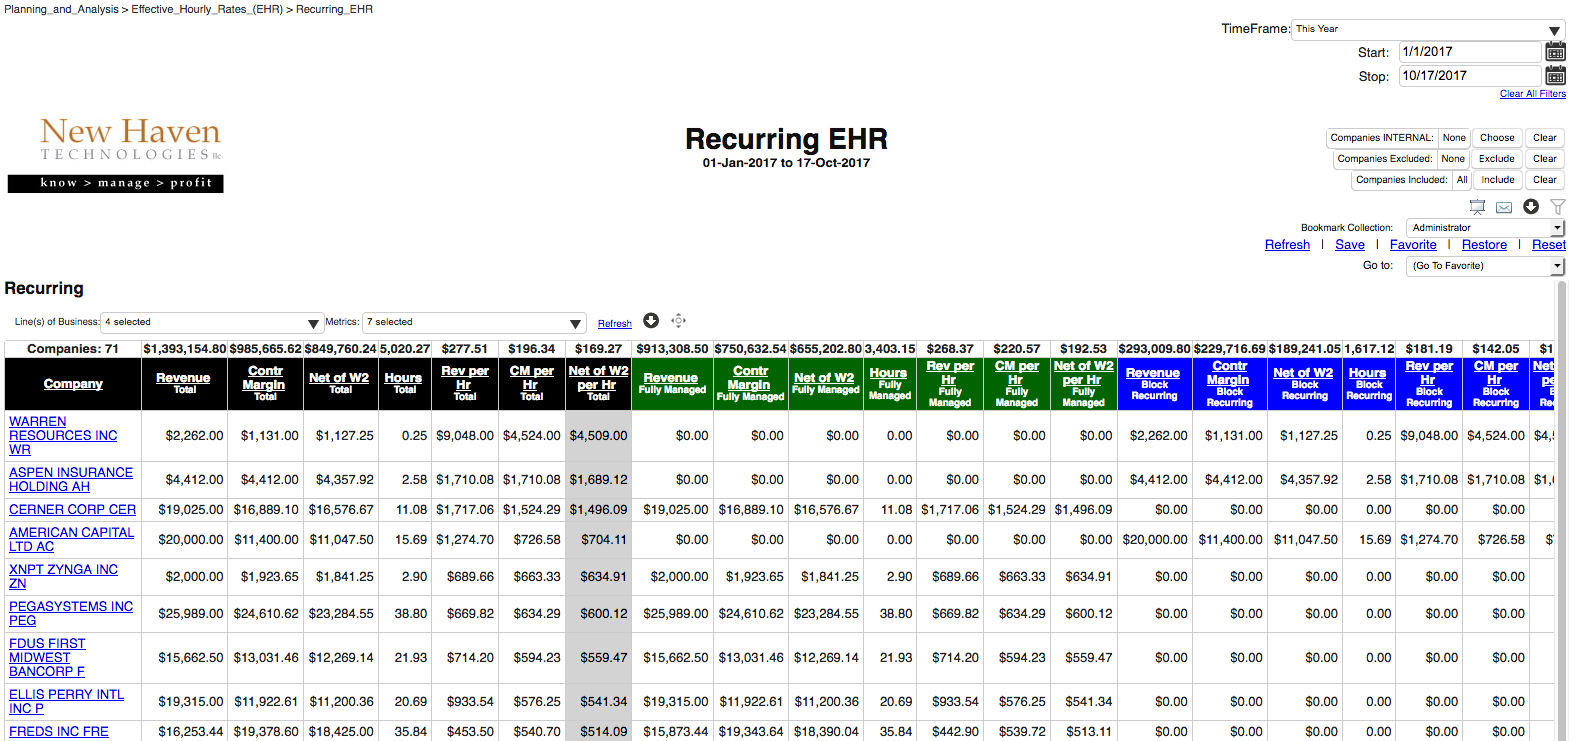
ARE YOU SUCCESSFUL WITH RECURRING REVENUE?
Monthly Recurring Revenue (MRR). It is what we focus on and a key driver to our overall success. But those “flat fee” contracts can be hard to evaluate, especially because your #1 factor between success and failure is how many hours your engineers spend on each client. It’s also a tempting place for an engineer to log some time so that they get their 40 hours per week reported, and it’s tempting because the customer is not getting an additional bill for the hours, so it’s unlikely that anyone will question the time.
Dashboards
Here’s a few examples of our dashboards:
YOU CANNOT MANAGE WHAT YOU CANNOT MEASURE
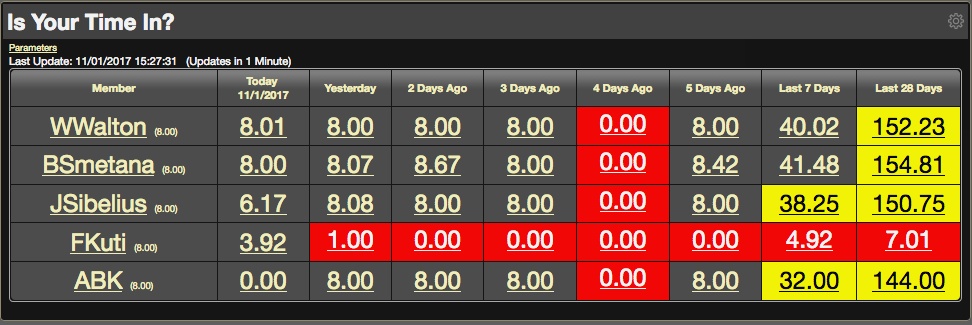
Hey! Get your time in!
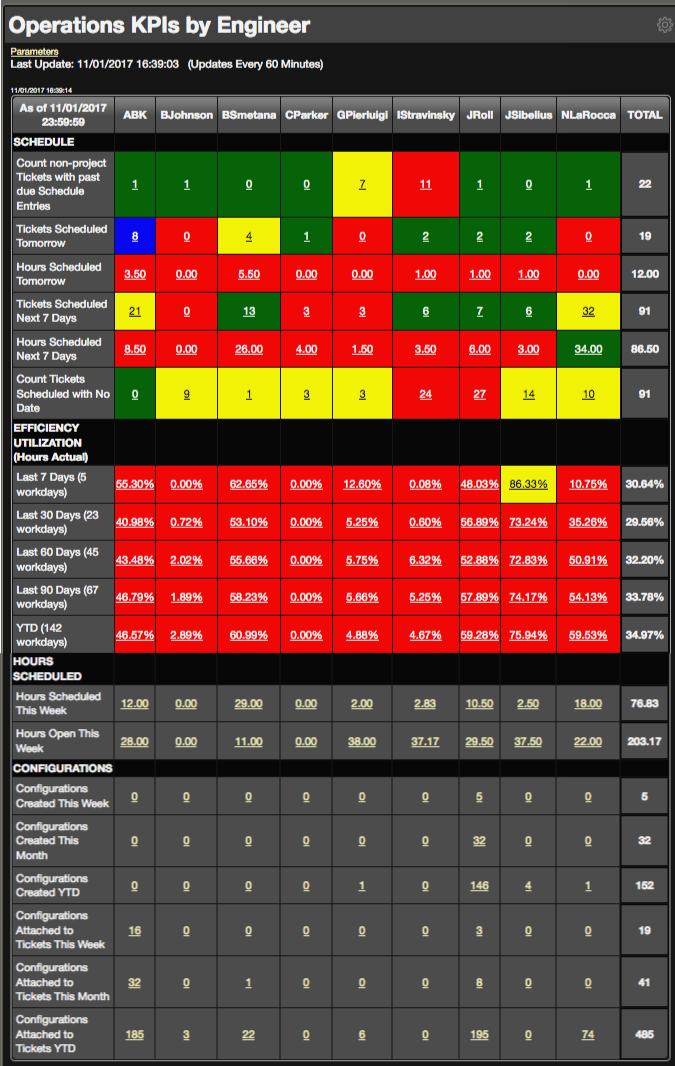
HOW’S YOUR SCHEDULE? TICKETS? UPDATING CONFIGURATIONS?
Being an engineer is no easy task. You need to manage your schedule. Plan your work. Work your plan. Keep up on assigned tickets. It’s easy to get distracted. Give them a gentle reminder of where you’d like them to focus.
TAILORED TO SUIT YOUR NEEDS
You can pick-and-choose what Dashboard panels you use, and you can drag-and-drop them in any arrangement that you want to fit the screen that you have mounted on the wall. And remember, if we do NOT have a Dashboard that fits your needs, CUSTOM DEVELOPMENT is included in your monthly subscription at no additional charge (and that applies to reports, dashboards and smartphone reports). So you don’t have to ‘make due’ with an ‘off-the-shelf’ option. We can bring the great idea that you have to life!
SmartPhone
Here’s a few examples of our SmartPhone reports:
LAST MINUTE MEETING PREP
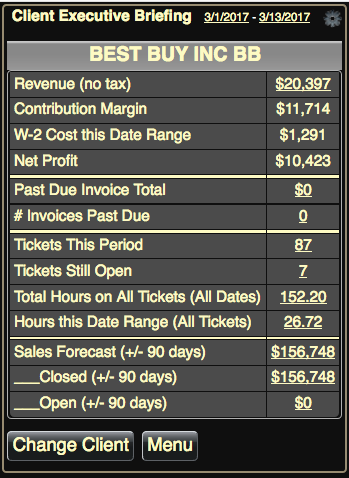
You’re sitting the lobby of the customer, getting ready to meet with the owner. It’s been a busy week so you haven’t had the time to prepare for the discussion as much as you’d like. But it’s important that you know about the status of the relationship with this client, and it’s ALSO important that the client ‘knows that you know’ so that you show you value the relationship. Client Executive Briefing shows you a synopsis of the relationship on one screen on your phone.
Free Custom Connectwise Reports
Included at no additional charge with your monthly subscription
REPORTS, DASHBOARDS AND SMARTPHONE REPORTS TAILORED TO EXACTLY FIT YOUR NEEDS
At some level we are all trying to solve the same problems. That’s why you benefit from the over 200 reports, dashboards and smartphone reports that are included in the Briefing Service. But you may also have a unique approach, method or metric to address your most vexing issue. You need the ability to make that solution ‘come to life’ with the assistance of software, and that’s why we include custom development at no additional charge in your monthly subscription. We work directly with you and your team to create the solution, then we include that solution as part of the Briefing Service so that all of our clients can benefit from YOUR great idea. You get exactly what you want. Other EBS clients get access to great ideas. And the Briefing Services just gets better and better…
Subscription is month-to-month with no long term commitment.
Interested?
- Request a one-hour web demo
- Request a custom ConnectWise report
- Sign up for a Free 2-Week Trial
- See a list of all
- MSP Newsletter
- See past issues
- Subscribe