Reports Overview
A sampling of some of our most popular traditional reports
We present information to you in a variety of formats, including traditional “report” formats. These reports can be viewed on-screen and/or e-mailed to you and your team on a schedule of your choosing. Here’s some of our most popular reports:
Profitability by Client
Stack-rank your clients by profitability
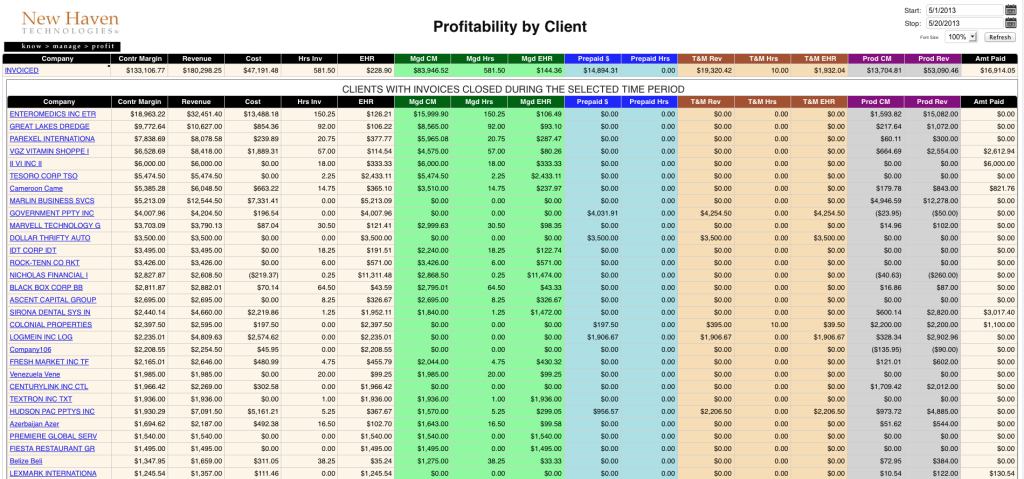
This report stack-ranks your clients based on profitability to your practice. You can have this report gather data from any date-range that you select. Drill-down to details on agreements for each client (and further into invoices and time entries). (Click the image to see a larger version)
Profile of All Clients
Overview of your portfolio of clients
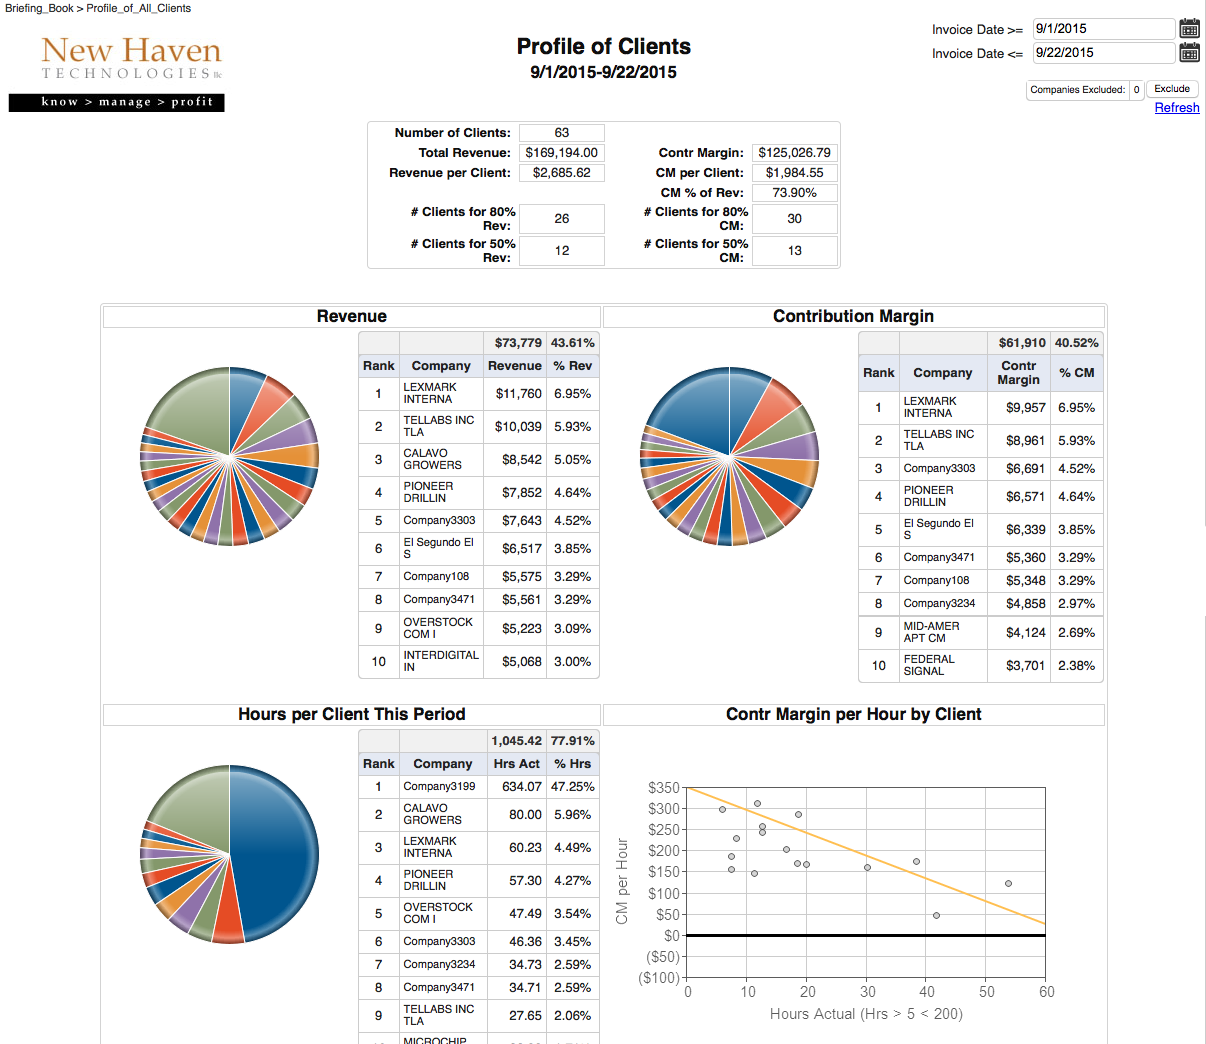
Shows your “portfolio of clients”, including average revenue and profitability per client, breakdown of revenue, profitability, hours and effective hourly rate (EHR) by client.
Profit per Agreement per Month
How much are you REALLY making on each agreement each month?

See how much PROFIT you are making on EACH agreement EACH month after you have paid your engineers for the time they have spent servicing that agreement.
Time Entry Sieve
CATCH time entry errors BEFORE your TimeSheet Review
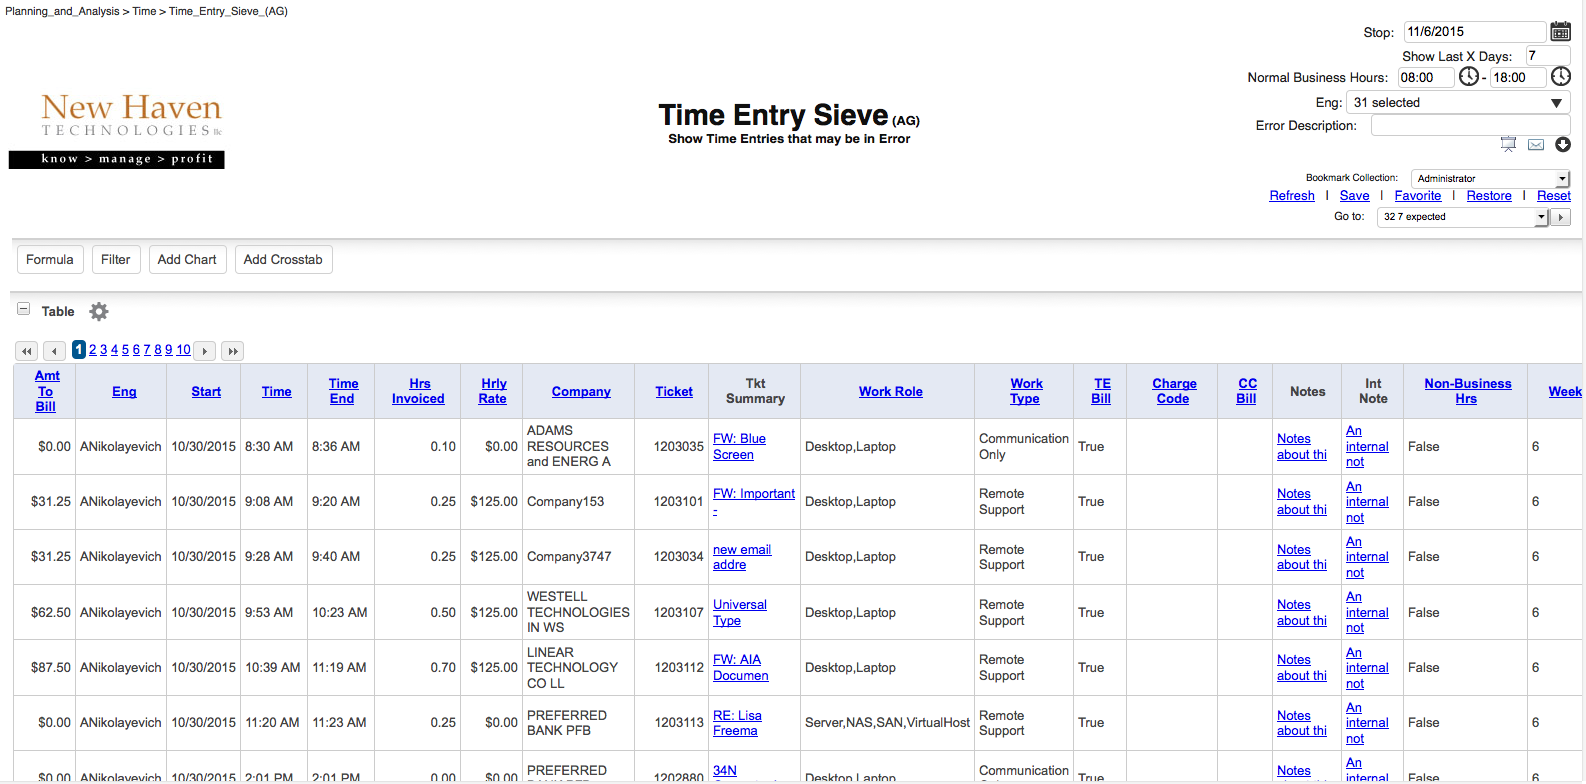
Show time entries, but FILTER them so they only show time entry ERRORS (and you have can this automatically e-mailed on a scheduled basis).
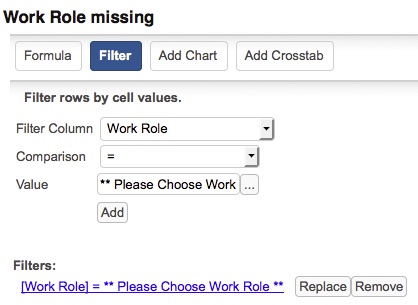
It’s easy for an engineer to forget to specify the Work Role (or Work Type) on a time entry. You may have a “default” role or type that gets put in, or it may just be blank. This example will notify engineers that they have a time entry that is “missing” a valid Work Role entry.
Engineering Team Performance and KPIs
Overview of performance by your engineering team
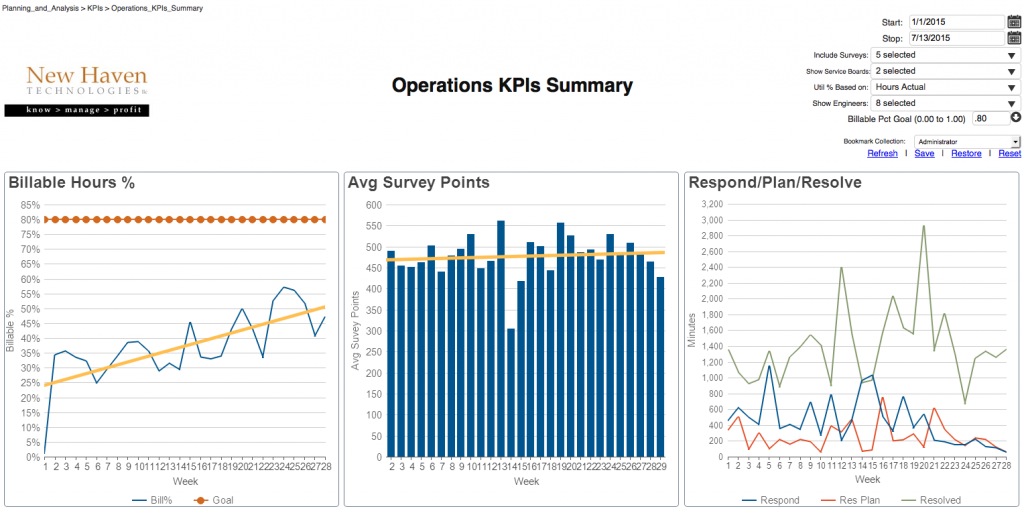
Summarize how your engineer team is doing on billable hours, survey feedback and responsiveness. (Click image for larger version).
Key Performance Indicators (KPIs) for Each Engineer
Comprehensive KPIs to drive engineer behavior
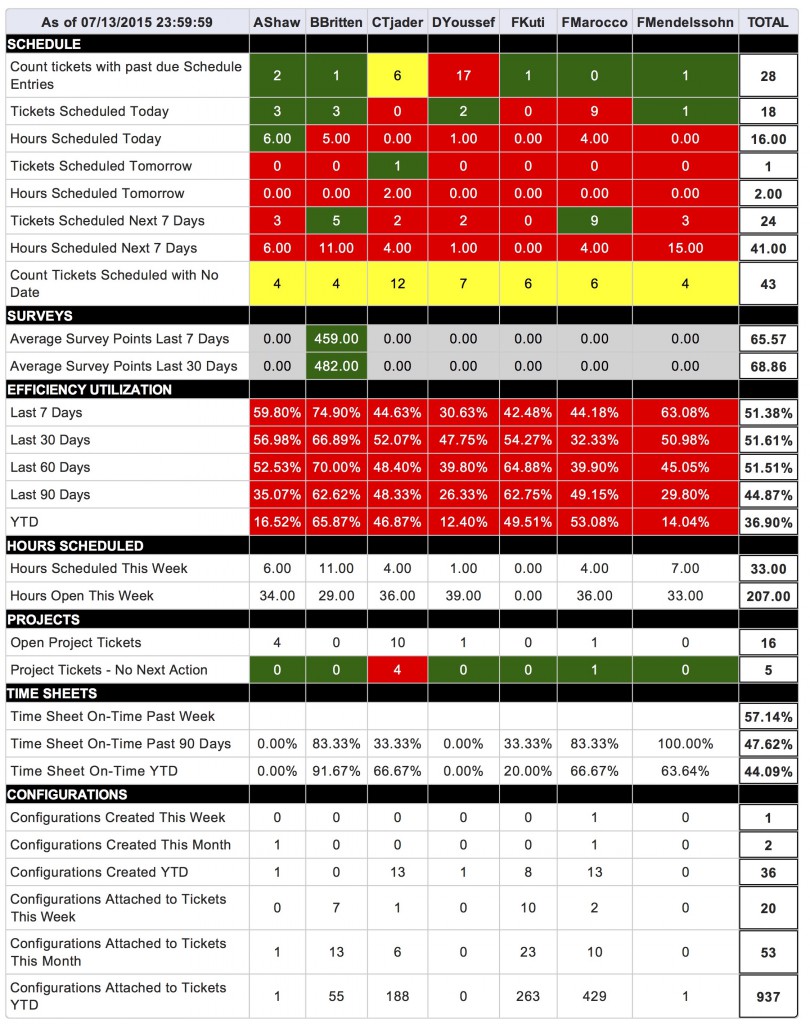
Provide feedback to individual engineers on how they are doing handling their schedule, client feedback, billable hours, projects, timesheets and recording client configurations. Also available as a Dashboard and a Smartphone report. (Click image to enlarge).

