
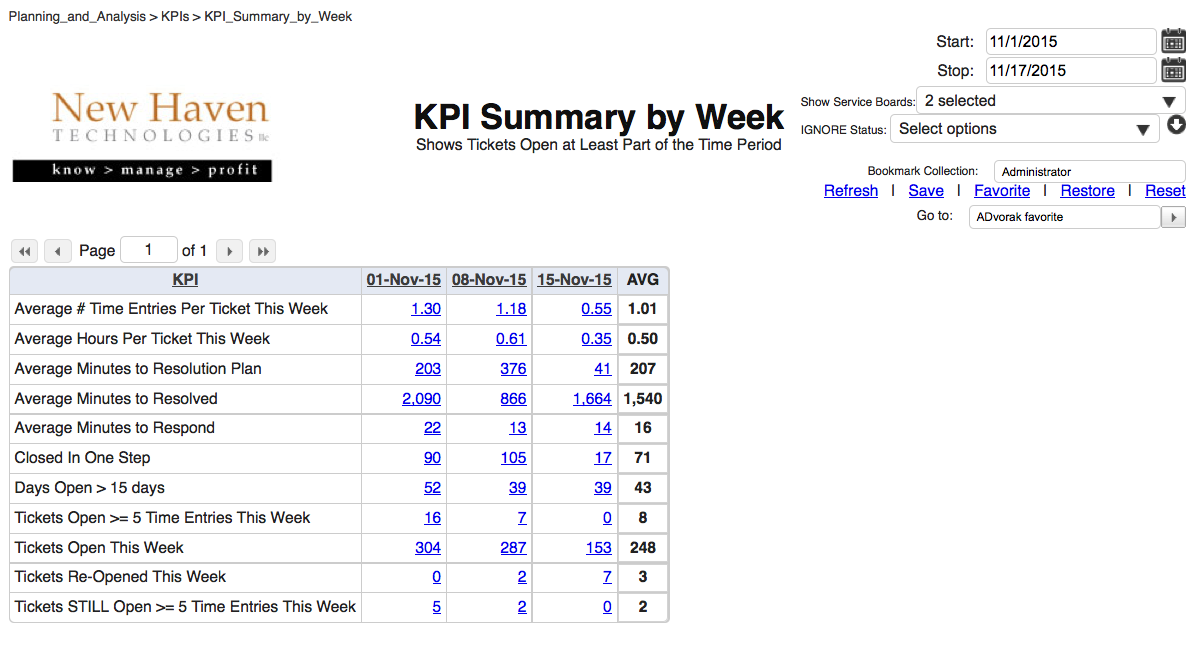
KPI Summary by Week
Grade the Quality of your Service in a Glance
See a quick summary of the quality of your service based on responsiveness, time to resolution, re-opened tickets, and more.
PURPOSE
The purpose of the KPI Summary by Week report is to help you quickly get an understanding of the quality of the service that you and your team are providing to your clients.
WHY IS THIS IMPORTANT?
It’s pretty simple: Clients won’t put up with poor service for very long. Providing high quality service is strategic to attracting and retaining clients, and growing your business by keeping your attrition rate low.
REPORT ITEMS
Each item on the report can be clicked to see detailed drill-down
Average Number of Time Entries per Ticket this Week – Looks at two aggregates to calculate this figure:
- the total number of time entries recorded for tickets that were open at least part of that week.
- — DIVIDED BY —
- the total number of tickets that were open at least part of that week (including any open tickets that did NOT have a time entry posted that week).
Average Hours per Ticket this Week – Looks at two aggregates to calculate this figure:
- the total hours (actual “non-rounded” time) recorded for tickets that were open at least part of that week.
- — DIVIDED BY —
- the total number of tickets that were open at least part of that week (including any open tickets that did NOT have a time entry posted that week).
Average Minutes to Resolution Plan – Average number of minutes until a Resolution Plan was recorded for tickets open this week that had a Resolution Plan recorded in the designated week.
Average Minutes to Resolved – Average number of minutes it took to reach a ticket status designated as “resolved” for tickets open this week that were resolved in the designated week.
Average Minutes to Respond – Average number of minutes it took to respond to tickets open this week that were responded to in the designated week.
Hours Scheduled Today/Tomorrow/Next 7 Days – Number of hours scheduled to be worked by this engineer in each of the timeframe categories.
Closed in One Step – Number of tickets that were closed in a single “step” in the designated week.
Days Open > 15 – Number of tickets that had been open more than 15 days in the given week.
Tickets Open >= 5 Time Entries this Week – How many tickets were open at least PART of the given week where engineering entered five or more time entries against that ticket?
Tickets Open this Week – How many tickets were open at least PART of the designated week?
Tickets Re-Opened this Week – How many tickets that were previously “closed” were re-opened during the designated week?
Tickets STILL Open >= 5 Time Entries this Week – How many tickets are STILL open where engineering entered five or more time entries against that ticket?
DRILL DOWN TO SHOW TICKETS
Click on any of the values to show the Tickets
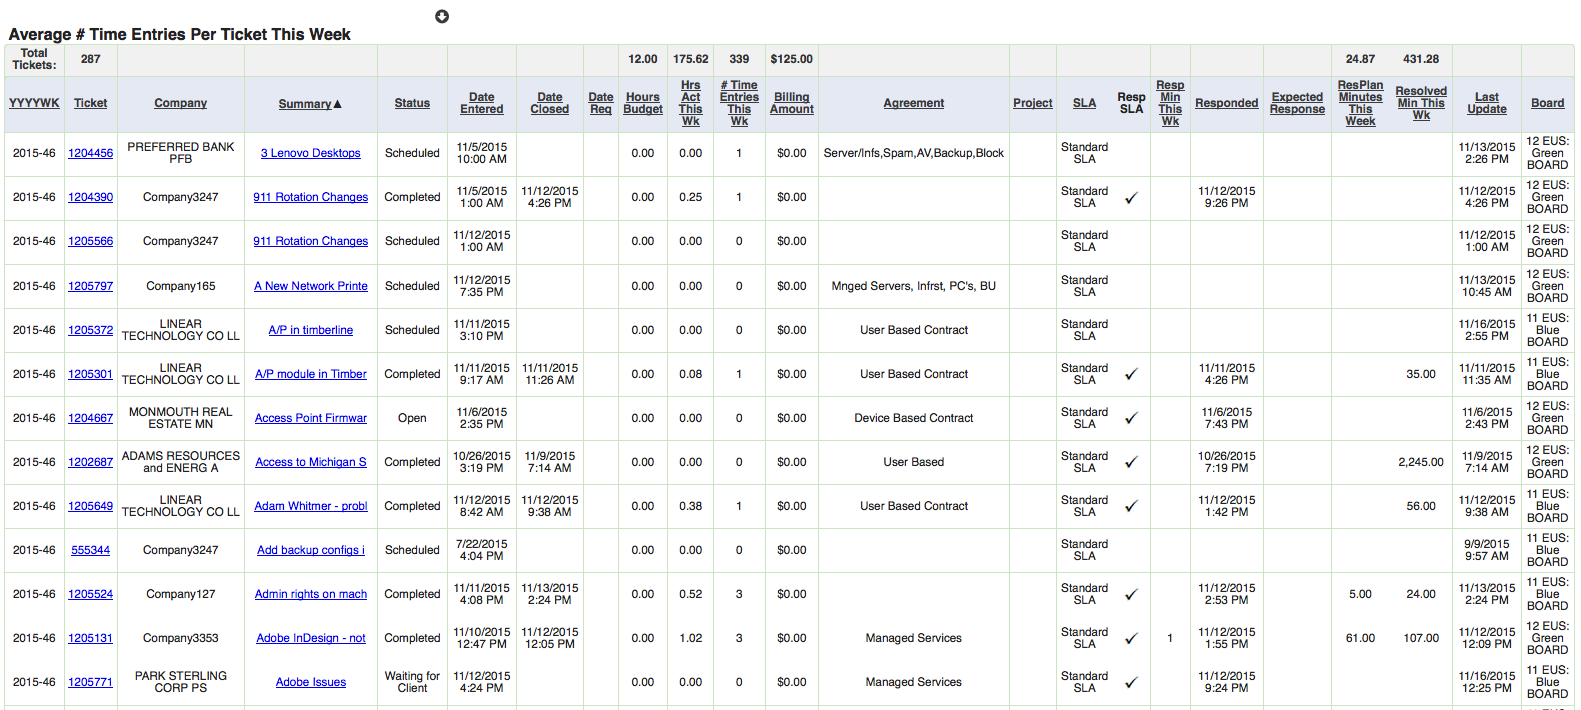
See the tickets that constitute the totals on the summary screen.
DRILL DOWN ON TICKETS TO SHOW TICKET DETAILS
Click on any Ticket to show Time Entry details and Notes
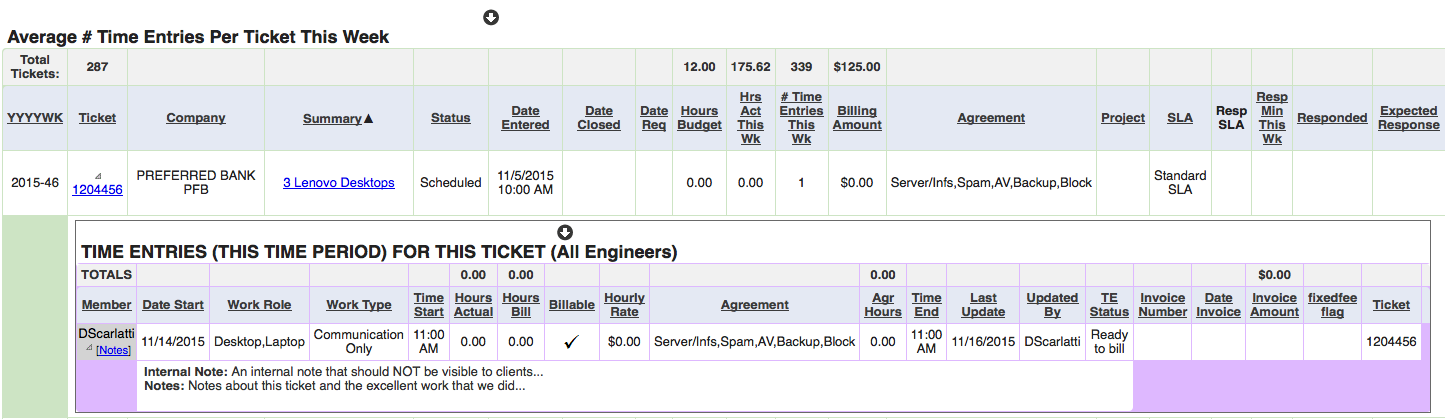
See the details of a ticket by just clicking the ticket number.