Understand month-to-month variations on any metric (Revenue, Net of W2, EHR, ROI, etc.) over any combination of your 10 Lines of Business
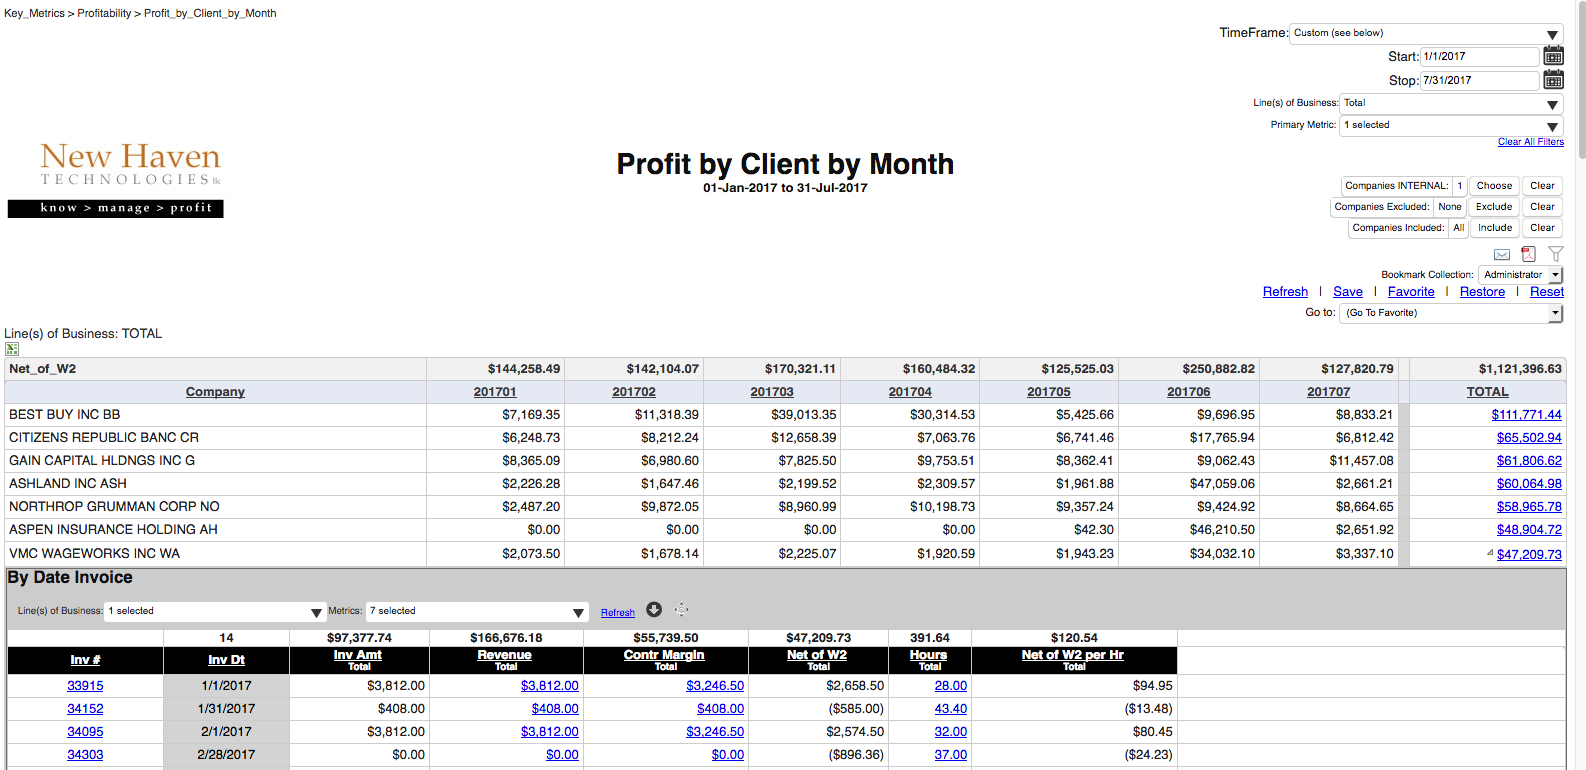
This report shows you the variation in client results from month-to-month over any timeframe you select. The default is to show your total organizational results and profit (i.e. ‘Net of W2’, which factors in 3rd party costs AND allocation of internal labor costs). Here’s what that looks like (click image to enlarge):
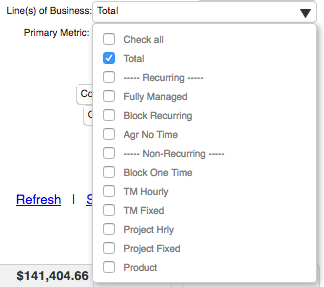
Want to analyze just PART of your business? (Fully Managed, for example). You can pick and choose any combination of 10 Lines of Business from the drop-down menu to see ONLY the portion that you selected.
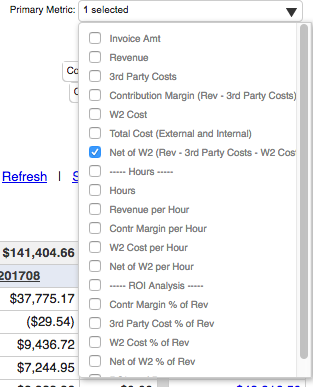
Perhaps you want to see another metric (like ‘Net of W2 per Hour’, for example). Select from over 30 metrics to show for your analysis from the Metrics drop-down menu:
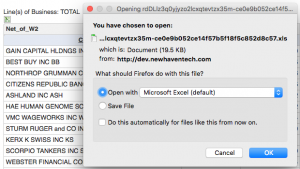
Seeing this on the screen is great, but maybe you want to export the data to Excel for further analysis. Just click the Excel icon (just above the table).
[xyz-ihs snippet=”Request-Web-Demo-button”]

