
Profile of All Clients
See a “Board of Directors” view of your Portfolio of Clients
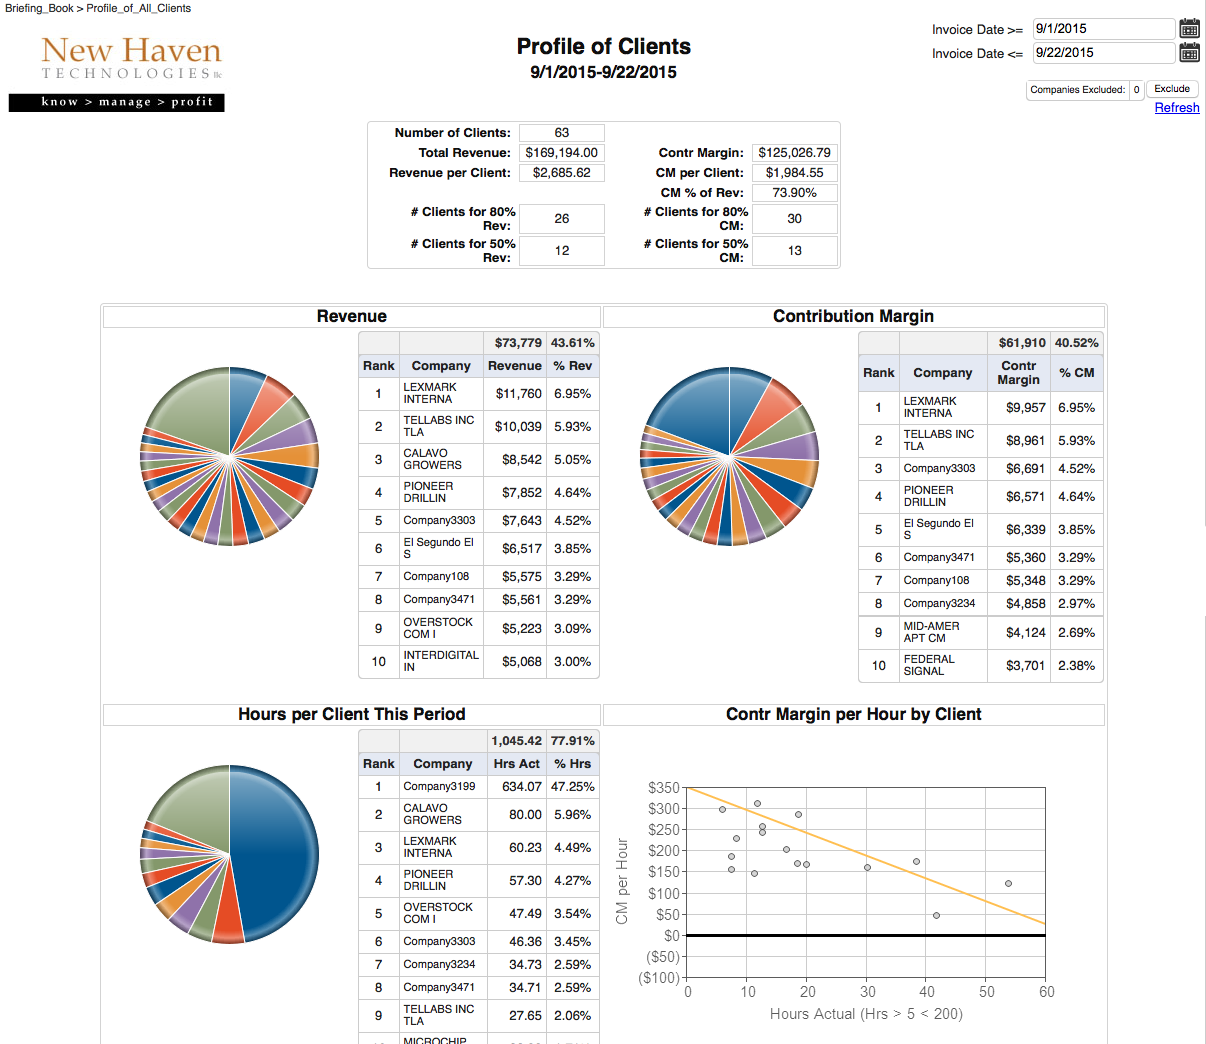
Shows your “portfolio of clients”, including average revenue and profitability per client, breakdown of revenue, profitability, hours and effective hourly rate (EHR) by client.
PURPOSE
The purpose of the Profile of All Clients report is to allow you to understand the nature of your portfolio of clients. This includes total number of clients, average revenue and profitability, distribution of revenue, profit and engineering hours, and more.
WHY IS THIS IMPORTANT?
It is important to know if you are “overly reliant” on any given client, as well as to understand revenue, profit, and engineering hours for your top clients. If one client represents more than 15% of your revenue or profit, your business may be at risk if that client chooses to terminate their contract. Understanding your average revenue and profit from each client is valuable both for planning purposes as well as goal-setting.
REPORT ITEMS
Number of Clients – Total number of clients that were invoiced during the time period that you selected via the “Invoice Date” filters.
Total Revenue – Total amount invoiced to clients during the period.
Contr Margin (Contribution Margin) – The total amount of revenue you have remaining AFTER you have paid your 3rd party vendors. NOTE: This amount is calculated BEFORE you have “paid” your engineers by allocating their W-2 cost on an hourly basis.
CM % of Revenue (Contribution Margin as a percent of Revenue) – This percentage gives you an indicator of your profitability BEFORE you have “paid” your engineers by allocating their W-2 cost on an hourly basis.
# Clients for 80% Revenue – The number of clients which represent 80% of your total revenue. If you are resource-constrained or looking to downsize your business for other reasons, this gives you an indication of how many clients you could exit and still achieve 80% of your revenue.
# Clients for 50% Revenue – The number of clients which represent 50% of your total revenue. Again, this might be a valuable insight if you are looking to downsize your business to focus on your most valuable clients.
# Clients for 80% (50%) CM – The number of clients which represent 80% (50%) of your total contribution margin.
Revenue (graph) – Top 10 clients based on revenue. Shows revenue and “% of total revenue” for each client, as well as for the “top 10” clients.
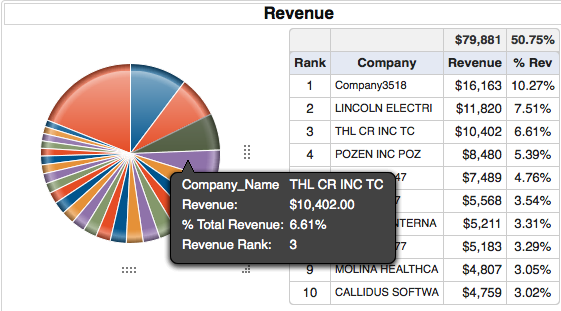
Hover over the pie chart to see details.
Contribution Margin (graph) – Top 10 clients based on contribution margin. Shows contribution margin and “% of total contribution margin” for each client, as well as for the “top 10” clients.
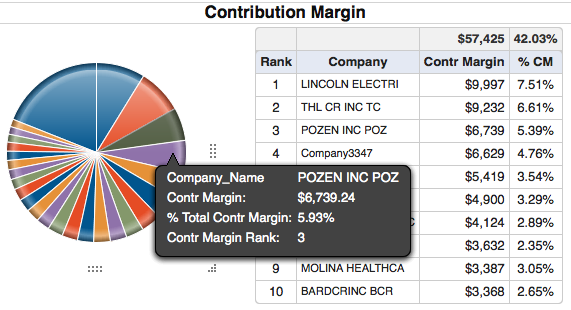
Hover over the graph to see details
Hours per Client this Period (graph) – Top 10 clients based on engineering hours spent working for that client.
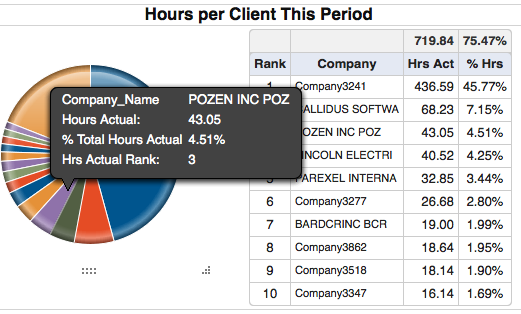
Hover over the graph to see details.
Contr Margin per Hour per Client (graph) – Shows the “Contribution Margin per hour” (Y-axis) for each client versus the number of hours spent with that client (X-axis). The gold “trend line” shows how deeply you are discounting your hourly rate as you sell more hours to any given client. [Hover over each bubble on the chart to see the details for that client.] Look especially at the bubbles that are below the trend line to find those clients who may be good candidates for an hourly price increase.
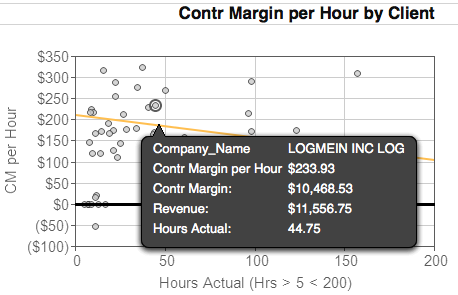
Hover over the graph to see details.