Encourage your engineers to manage tickets, their schedule, customer satisfaction, billable time, timesheets and configurations (available as both a report and a dashboard)
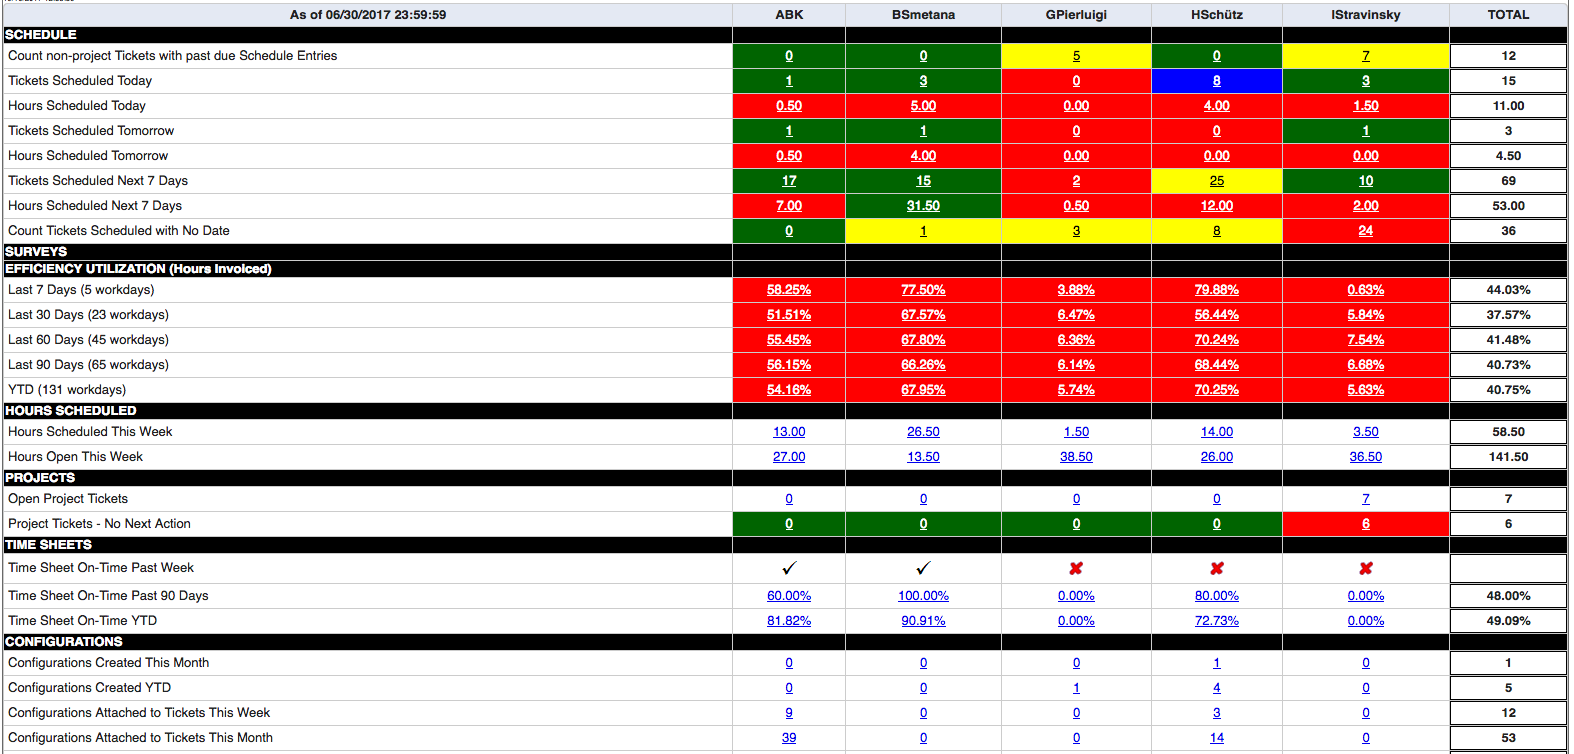
Being an MSP engineer is tough. It’s easy to get distracted. The ‘Operations KPIs by Engineer’ report packs a LOT of topics (that each engineer must pay attention to) into a single report. Let’s take a look at the report, then I’ll explain the sections (click image to enlarge):
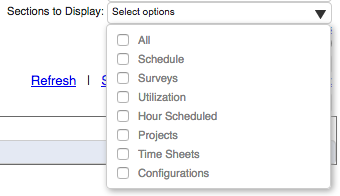
There are seven ‘sections’ of the report, and you can pick-and-choose which sections you want to display. Each section of the report starts with a black report row that shows the section name. Let’s cover each section:
SCHEDULE
How well are you doing to schedule the time and tickets that you will work on today? Tomorrow? The next 7 days? Do you have ‘past due’ activities on non-project tickets? Do you have tickets that may have ‘fallen through the cracks’ by being assigned to you but NOT designated to happen on a specific date?
SURVEYS
Our example screenshot does not show entries for this section, but this section provides survey feedback for each engineer over a variety of timeframes.
UTILIZATION
What percentage of your time is spent on billable client work? Various timeframes are examined from ‘this week’ to ‘this year’.
HOURS SCHEDULED
Looking at this week, how many hours do you already have ‘scheduled’ on your calendar, and how many hours are ‘free’?
PROJECTS
How many ‘open’ project tickets have you been assigned that are still ‘open’? Do you have project tickets assigned to you that do NOT have a ‘next action’ defined for them? (i.e. they may be ‘stalled’ or forgotten).
TIMESHEETS
Did you get your timesheet submitted ‘on time’ this week? What percentage of the time have you submitted them on time over the last 90 days? Year-to-date?
CONFIGURATIONS
How many configurations have you created this week? This month? This year? How many of those configurations have you ‘attached’ to tickets?
[xyz-ihs snippet=”Request-Web-Demo-button”]

