Profit per Agreement per Month
How much PROFIT are you making on each agreement each month
AFTER you pay your engineers for their time?

PURPOSE
The “Labor Loaded Gross Margin by Agreement” report shows how much PROFIT you made on EACH agreement EACH month, even after you have “paid” your engineers for the time they spent working on that agreement that month.
WHY IS THIS IMPORTANT?
Obviously, it’s important to know if you are “making money” on a client. In a fixed-fee managed services scenario, you may have “an incident” in any given month where you have to spend more time with that client (so you may not be profitable with them that month). The question is: Am I profitable with that client over a longer-term view? If not, you may need to:
- Adjust (raise) the price charged to the client each month.
- Be more proactive via preventative maintenance with this client to address an ongoing, nagging issue.
- More carefully manage (i.e. reduce) the number of engineering hours you spend on this client each month.
- Assign “less senior” (i.e. less expensive) engineers to service this account whenever possible.
REPORT ITEMS
AGR Type – Agreement Type. You can filter the entries displayed on this report based on this field via the filters in the upper-right hand corner of the report screen.
Company – The client company name. If this client has more than one agreement with you, you will see one row for each agreement type (taking into account the filters you have selected as well).
AGR Name – Name of the Agreement. Also allows “drill-down” to show invoices for this agreement by clicking the agreement name hyperlink.
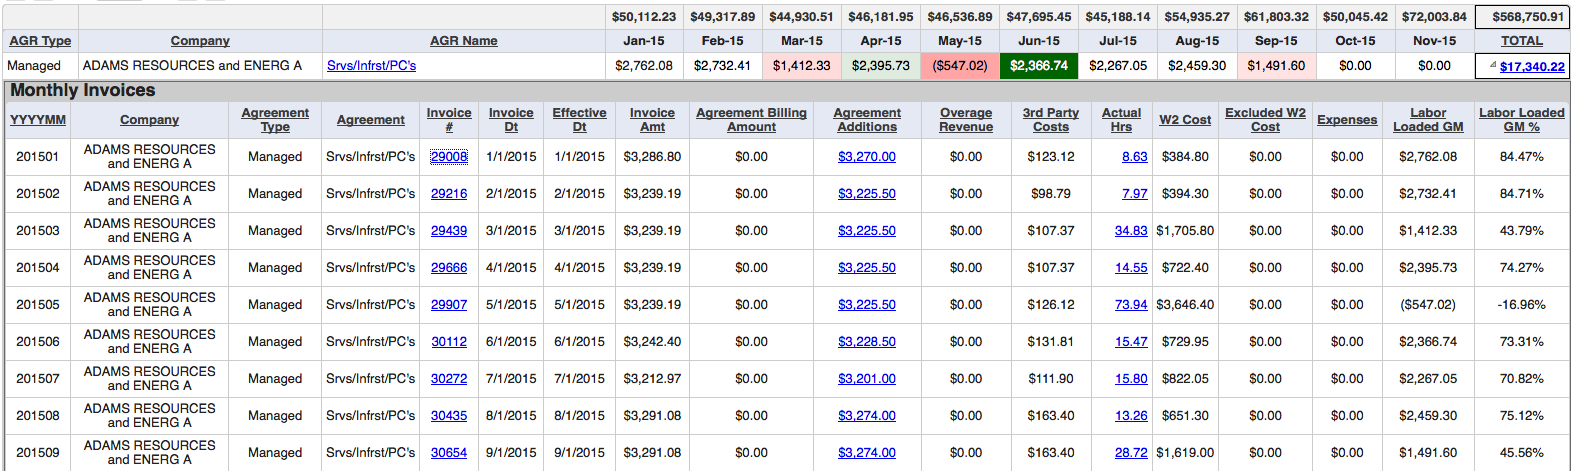
(Report Values) AMOUNT – If you have selected to “Show Amount” in the screen’s upper-right hand values, then the values shown represent the PROFIT that you made in each month over the time range you selected (upper-right of the report screen). Each column represents the profit for a given month. Values displayed in varying shades of GREEN indicate that your profit that month is UP versus the prior month (darker shades of green reflect greater intensity of the month-to-month change). Values displayed in RED indicate that monthly profits FELL that month versus the prior month. Total amount of profit you earned across all selected agreements is shown at the TOP of the column for that month.
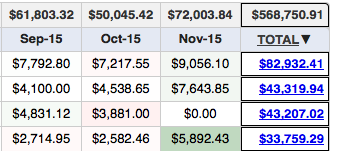
(Report Totals) TOTAL AMOUNT – If you have selected to “Show Amount” in the screen’s upper-right hand values, then the amount in the far-right “TOTAL” column shows the total PROFIT that you have made from this client over the timeframe range you have selected. NOTE: You can CLICK on the word “TOTAL” to sort the report by the total amount of profit from each agreement. The first click shows you where you earned the MOST profit (i.e. sorts “descending”), and clicking again shows you where you earned the LEAST profit (i.e. sorts “ascending”). Total amount of profit you earned across all selected agreements for the entire timeframe is shown at the TOP of the TOTAL column.
Click “TOTAL” to sort
(1st click: descending; 2nd click: ascending)
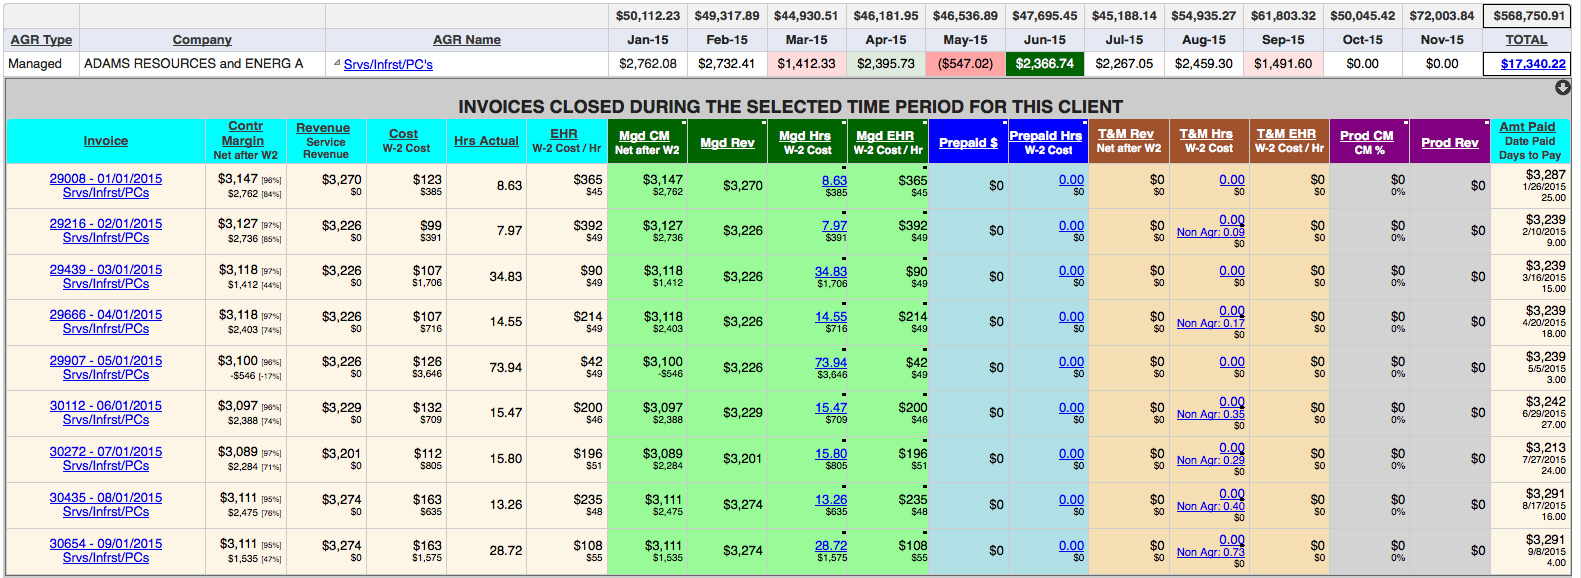
Clicking on the “amount” in the TOTAL column drills-down to the monthly details for that agreement.
Click the “amount” in the TOTAL column to see the month-by-month details.
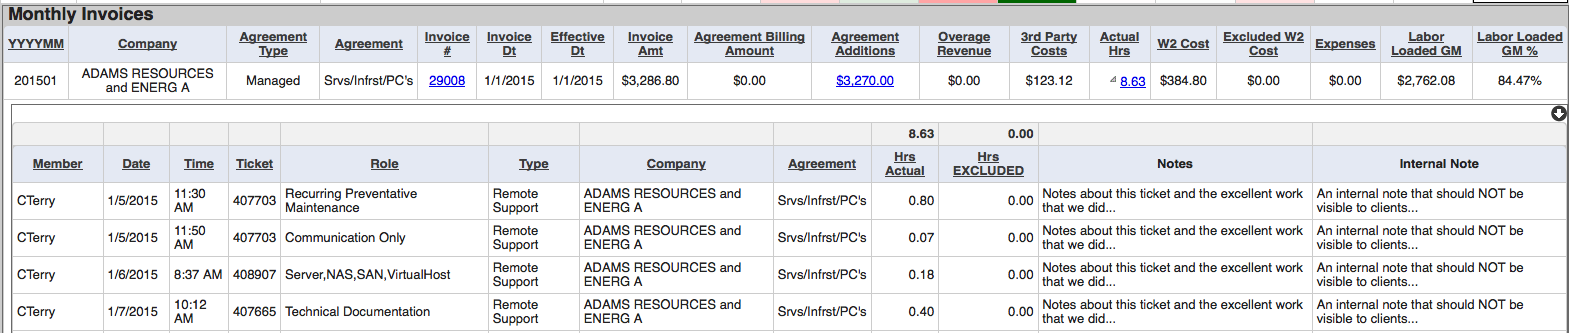
You can see the exact details of the invoice by clicking on the invoice number for any month in your time range:
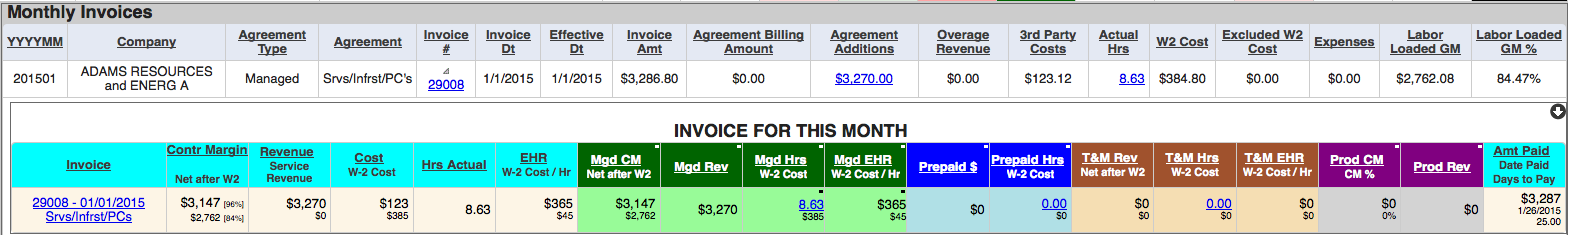
Where did we spend our time on that agreement that month? Click on the “hours actual” to see the details: