
What you need to know, available via one click of the mouse
We’ve added a series of new reports with one goal in mind: Give you KEY information you need by just a single CLICK of the mouse. We categorize these key metrics into three categories:
- Profitability
- Effective Hourly Rate (EHR)
- Return on Investment (ROI)
As with all information in the Briefing Service, the reports include hyperlinks so that you can drill-down to ‘more detail’ on the information you see. That lets you determine if you have a problem in the data you have in ConnectWise, or if you have a real business problem that you need to address.
PROFITABILITY
Start with ‘Total Profitability’ to see ‘if’ you are making money and ‘why’ you are making money. ‘Why’ are you making money? It’s because the results from clients where you are profitable exceed the results from the clients where you are not making money. And remember, ‘labor’ is your biggest expense, so it’s a key factor to take into account. Here’s the stack-rank of clients based on profitability in the ‘Total Profitability’ report (click to enlarge);
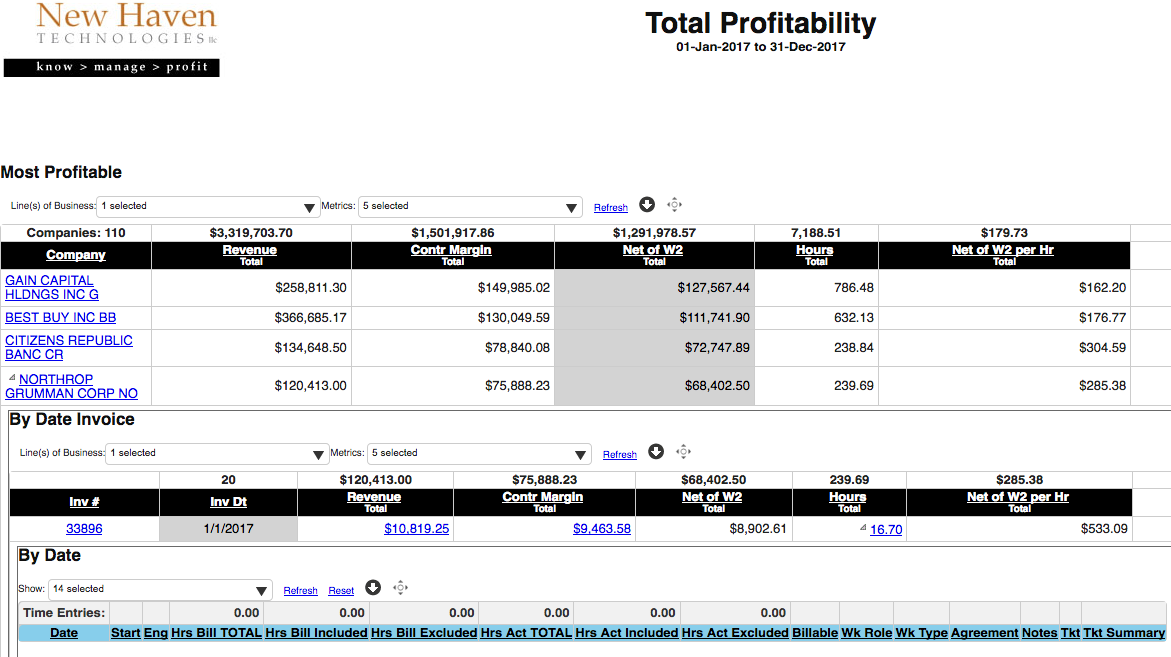
So you can see which clients are profitable (and ‘not’). That lets you embrace and protect those profitable clients, and perhaps ‘say goodbye’ to the ones at the bottom of that profitability stack-rank. But which of your engineers is driving that success by contributing more to your bottom line? The ‘Engineer Profitability and W-2 Multiple’ report answers that question in a single click. The ‘Net Profit’ column (3rd column, and shaded in the example below) shows you how much profit this engineer generated in excess of what you are paying him/her. The report is stack-ranked based on that calculation (which is why it is ‘shaded’) (click image to enlarge):
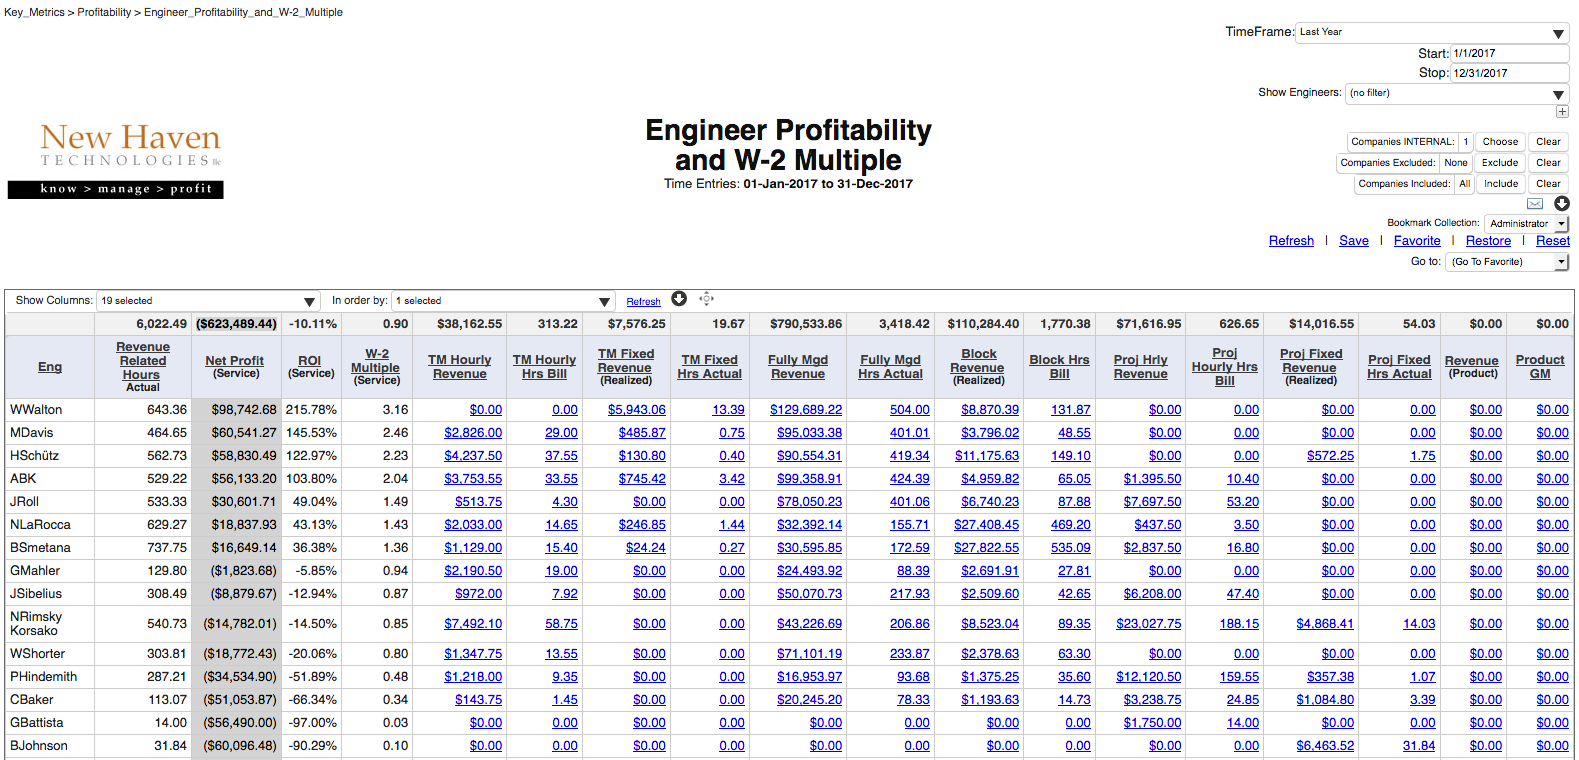
Which engineers are you making money on? What is the ROI for each engineer? How much do they make for you for each hour they work for a client? (and for ALL hours they work?)
OTHER REPORTS IN THIS CATEGORY
- Profitability
- Total Profitability
- Total Profitability by Month
- Profit by Client by Month
- Engineer Profitability and W-2 Multiple
- Reports by Line of Business
- Fully Managed Profitability
- Fixed Fee Profitability
- Projects Profitability
- Product Sales Profitability
- Time and Materials Profitability
- Monthly Recurring Revenue (MRR) vs. One-Time
- Recurring Profitability
- Non Recurring Profitability
EFFECTIVE HOURLY RATE (EHR)
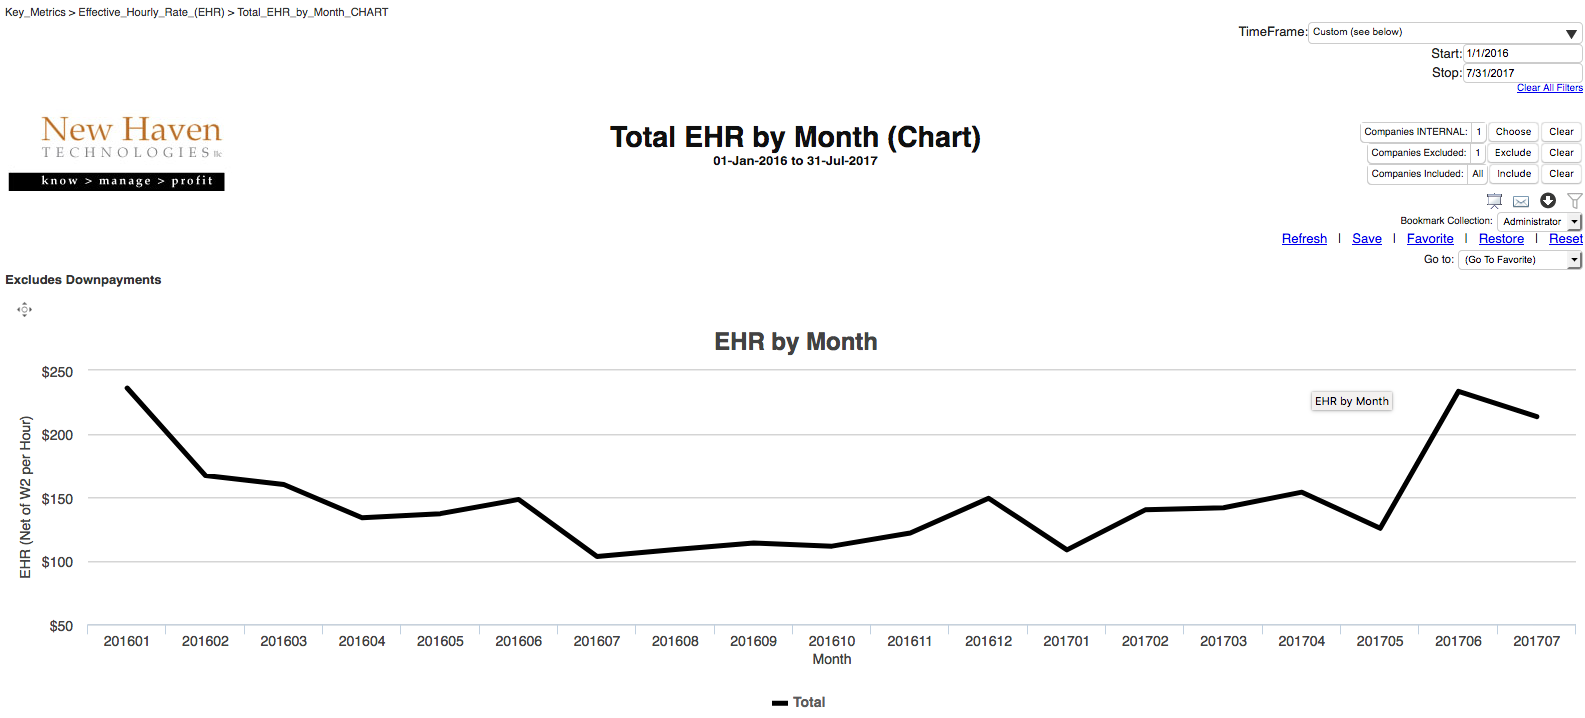
Looking across your entire business, how much are you making for every hour that your engineers work for clients over the last several months? The ‘Total EHR by Month CHART’ shows you a quick snapshot (click image to enlarge):
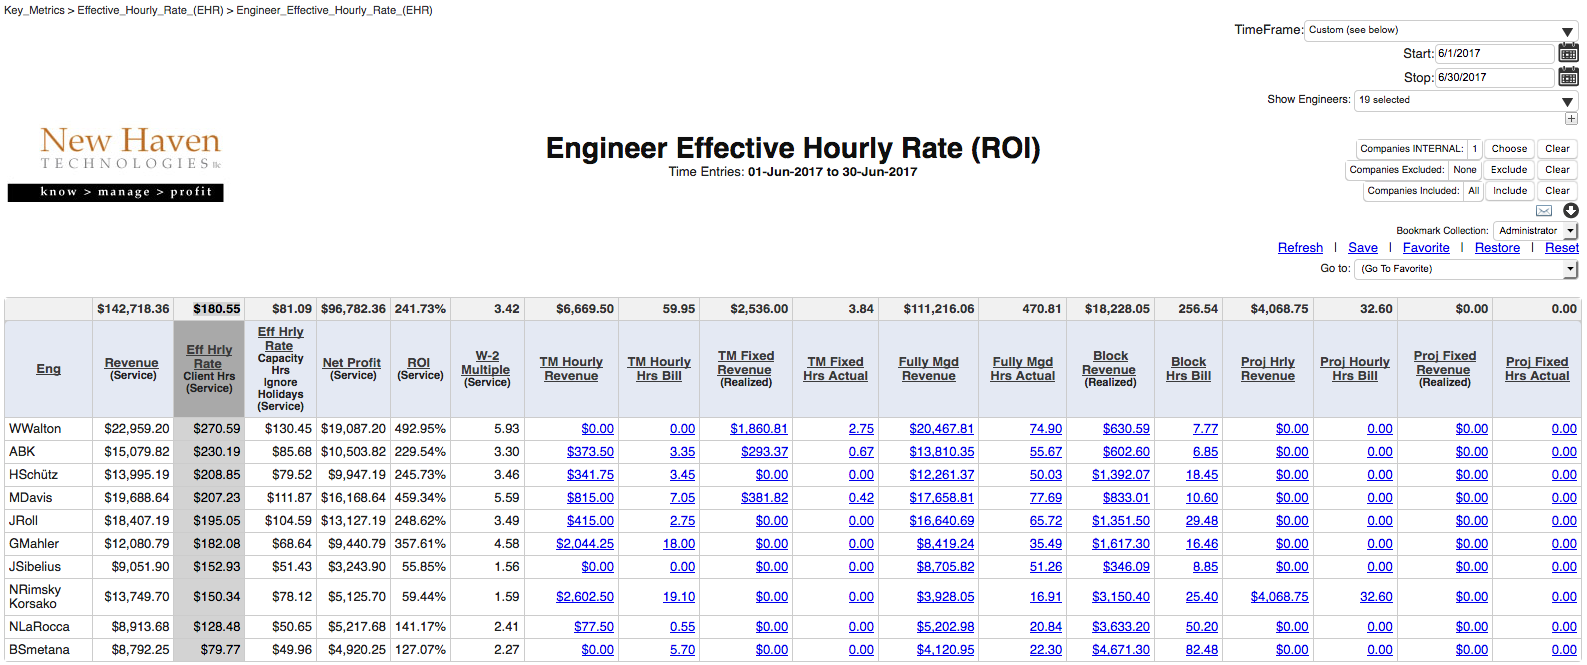
You can see what you are earning for each hour your engineers work as a group. But how much does EACH engineer produce for every hour they work for a client? And also, how much do they drive for EVERY hour you pay them (whether they are working on client tasks or non-client activities including PTO). The ‘Engineer Effective Hourly Rate (EHR)’ report shows you BOTH of those EHR metrics (‘client work hours EHR’ and ‘all hours EHR’). As you see in the report below, you make over $180 per hour for all hours spent working for clients, but taking ALL hours into account, your EHR drops to around $80 (click to enlarge):
OTHER REPORTS IN THIS CATEGORY
- Effective Hourly Rate (EHR)
- Total EHR
- Total EHR by Month
- Total EHR by Month CHART
- Engineer Effective Hourly Rate (EHR)
- Reports by Fixed Fee and Non-Recurring
- Fully Managed EHR
- Fixed Fee EHR
- Recurring EHR
- Non-Recurring EHR
RETURN ON INVESTMENT (ROI)
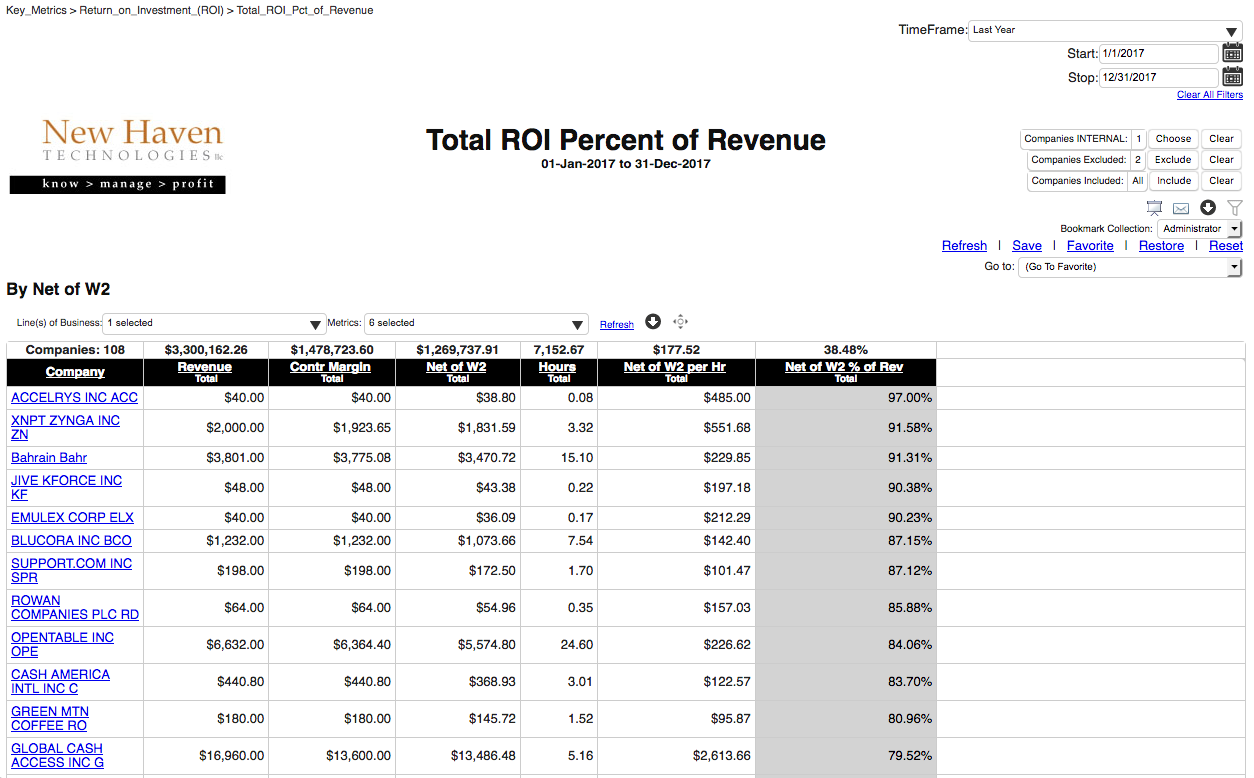
For each dollar of sales that you make to your clients, how much do you get to keep as profit after you have paid your 3rd party vendors and allocated the cost of your internal labor? The ‘Total ROI as Percent of Revenue’ report shows you that and stack-ranks clients based on their ROI. The example below shows that you make approximately 38% of revenue as net profit (keep in mind that this is ‘operating profit’ and does not reflect your fixed costs as well as the non-utilized hours of your engineering team). (Click image to enlarge):
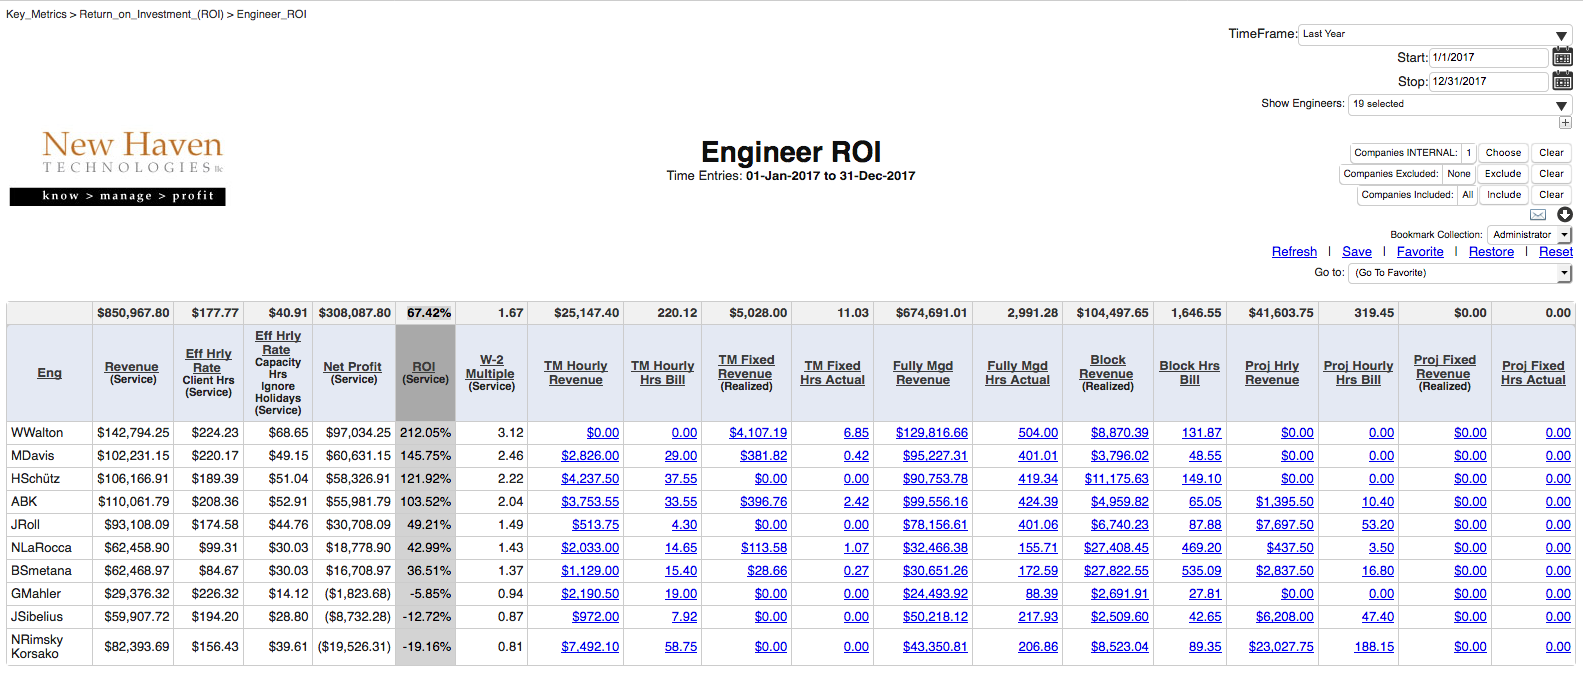
For each dollar that you pay each of your engineers, what ‘return’ do you receive for that investment? The ‘Engineer ROI’ report shows you that (click image to enlarge):
OTHER REPORTS IN THIS CATEGORY
- Return on Investment (ROI)
- Total ROI Pct of Revenue
- Engineer ROI
[xyz-ihs snippet=”Request-Web-Demo-button”]