Last time we talked about the importance of Leadership to the success of your MSP practice. We suggested that the first step in leadership is to “formulate a desired direction, trajectory or destination”. Today we begin that process by looking at the most fundamental outcome of your business activities: MARGIN.
|
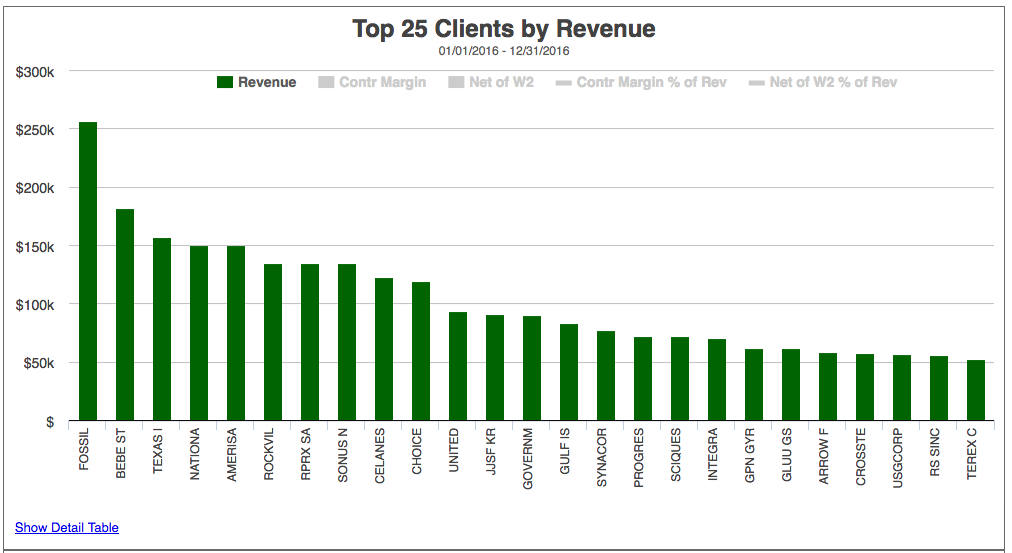
So our goal today is to find those areas of the business which have “margin” problems. So first we look at revenue (i.e. what we charged the client) for the last year:
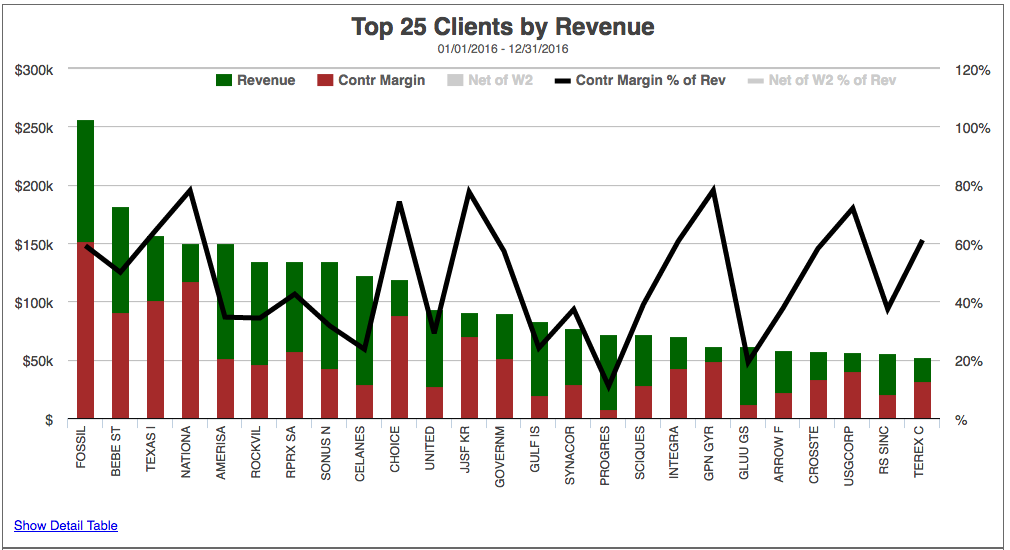
We see that we have sales revenue nicely distributed across our top 25 accounts. But how much of that revenue do we get to keep? Let’s subtract what we have to pay our 3rd party hw/sw suppliers and see what we have left:
Here’s a “quick reference guide” to the graph:
- Sales Revenue = Top of each GREEN bar
- Contribution Margin (Sales less 3rd party expenses) = Top of each RED bar
- Contribution Margin as percent of Sales = Black line
As you can see, we make more Contribution Margin on account #4 (from the left) versus both #2 and #3, even though our sales revenue is higher for accounts #2 and #3. Likewise accounts #5 through #9 produce less Contribution Margin than account #10, Also, we see that our Contribution Margin percentage (the black line) is very erratic. This may indicate a lack of control or guidelines available to the sales team regarding acceptable discounting procedures.
|
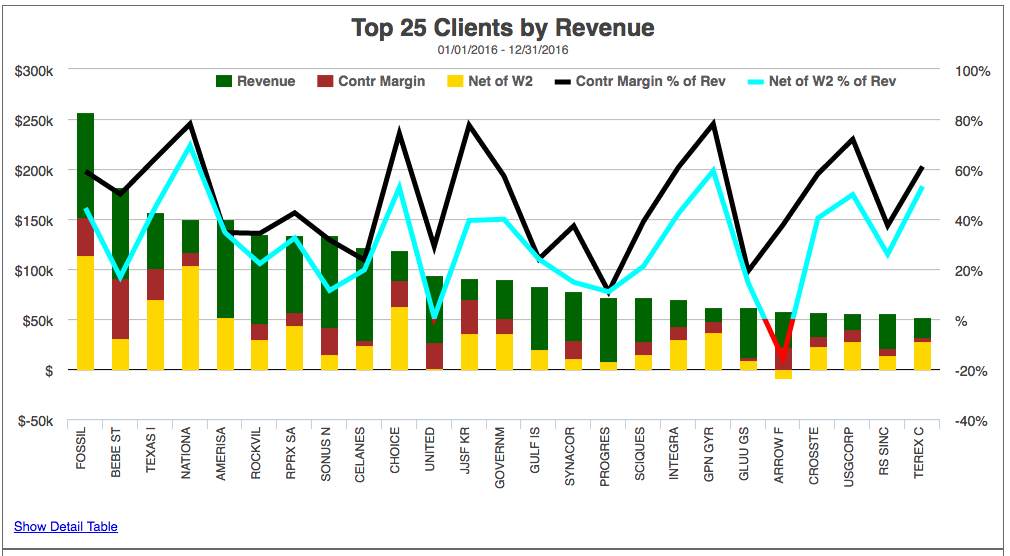
Next, let’s take a look at what is left over after we pay our engineers:
Here’s a “quick reference guide” to the graph:
- Sales Revenue = Top of each GREEN bar
- Contribution Margin (Sales less 3rd party expenses) = Top of each RED bar
- Net of W2 (i.e. Revenue less 3rd party less engineer costs) = Top of each GOLD bar
- Net of W2 as a percent of Sales = Aqua line
As you can see, we make FAR less on account #2, especially when we take into account what we have left over after we pay our engineers. Looking at the graph, we see that there is “no gold bar” on accounts #11 and #21. That indicates that we are LOSING money on those two accounts, even though they are in our “Top 25” revenue accounts.
|
SUMMARY
It is important to engage in this type of analysis so that you set a firm direction for your team. This conversation looked at “the bottom line” on an account-by-account basis. If you have pricing issues, or perhaps are using more senior engineering talent than is required on an account, NOW is the time to understand that and take action to improve the situation so that you can improve the results.
THE NEW HAVEN APPROACH
At New Haven, we provide visibility to the metrics that you need to improve the success of your MSP practice. We believe that YOU know best how to manage your business, but that getting access to the information you need to make “informed” business decisions can be daunting. That’s where we come in.
At New Haven Technologies, we provide access to information so that you can make data-driven, informed decisions about your MSP business. Our service is provided on a month-to-month basis, and starts with a free two-week trial on your network with your data. We also include customized reporting, dashboards and SmartPhone reports, all at no additional cost as part of the service. If you are interested in learning more, just “reply” to this e-mail, or point your browser to https://www.newhaventech.com/GALLERY to see examples of our work. We include “custom ConnectWise reports” in your monthly subscription at no additional charge (see https://newhaventech.com/free-connectwise-custom-reports) You can sign up for your free two-week trial at https://www.newhaventech.com/Trial
Best Wishes for continued success in building your MSP practice!
Dave Keller
Founder and Chief Consulting Officer
New Haven Technologies, LLC
Keller.D@NewHavenTech.com
(765) 335-KNOW
Stop Guessing. Start Knowing.
www.NewHavenTech.com


