
Profitability by Client
Stack-rank your clients on profitability to you over any time frame you choose
Do you ever wonder:
- AM I making money?
- WHY am I making money?
- WHERE am I making money?
- Where am I LOSING money?
The Profitability by Client report gives you all that. Here’s a quick look at your overall business:
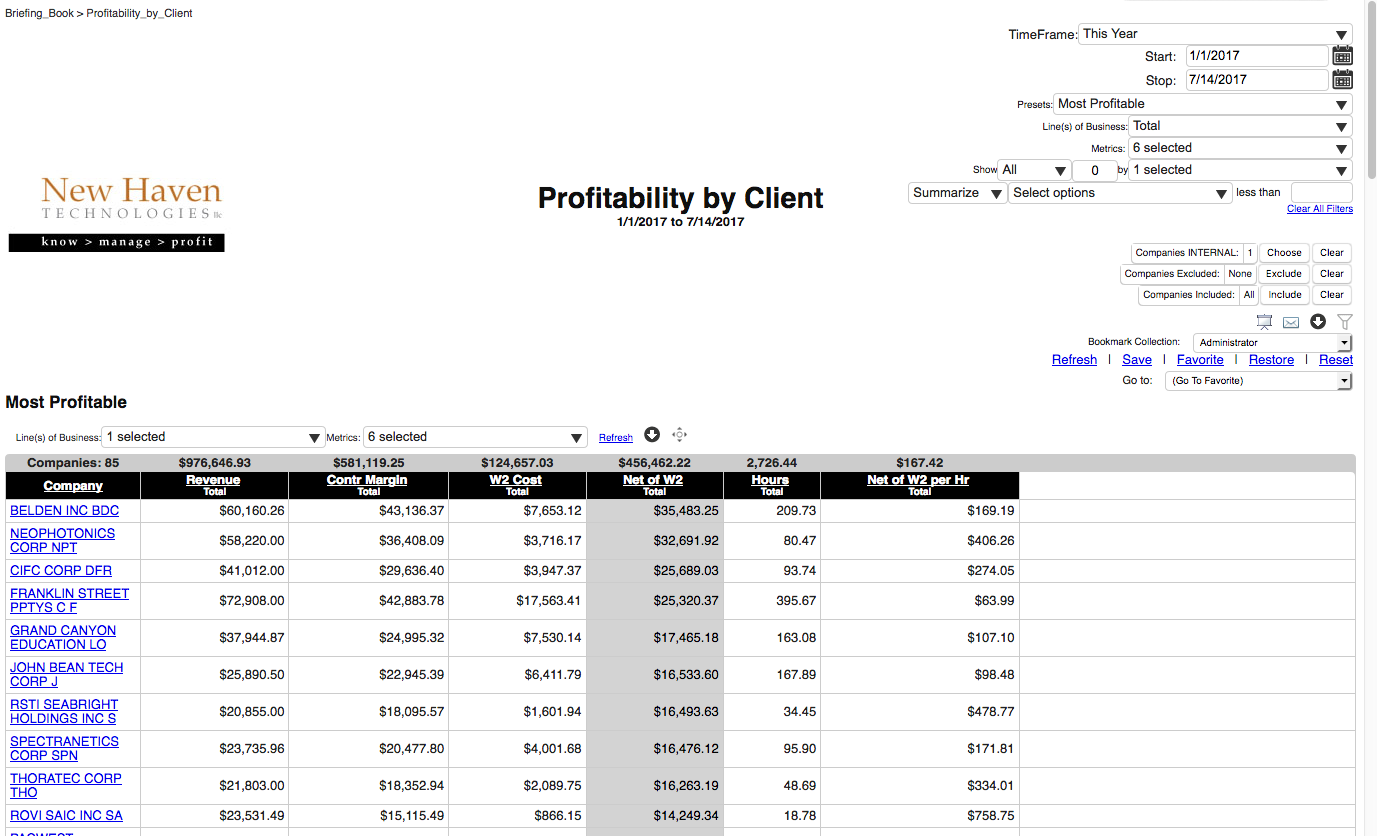
This report stack-ranks your clients based on profitability to your practice. You can have this report gather data from any date-range that you select. Drill-down to details on agreements for each client (and further into invoices and time entries).
(Click the image to see a larger version)
FROM THIS I KNOW:
AM I MAKING MONEY?
If my annual ‘fixed costs’ (i.e. rent, utilities, all salaries, etc.) are less than the $581k I received in Contribution Margin (i.e. revenue less 3rd party expenses), then I AM MAKING MONEY.
WHO IS MY MOST PROFITABLE CLIENT?
I made $35k in profit (even after I paid for my engineer’s time) at “Belden Inc.”. I earn $169 per hour in profit for every hour that my team works on that client.
WHERE AM I MAKING MONEY?
My top 4 accounts make up nearly one-fourth of my profit. I see that by adding up the “Net of W2” (i.e. the profit I made on each account AFTER I have covered all expenses including the cost of labor) for the first four accounts totals approximately $117k. Compare that $117k to the “Total Net of W2” of $456k shown at the top of the column indicates one-fourth of my profit comes from those four accounts.
WHERE AM I LOSING MONEY?
Just click the column header “Net of W2 Total” to re-sort the list based on Net of W2, and you’ll see your LEAST profitable accounts (starting with the ‘worst’).
HOW MUCH DO I MAKE FOR EVERY HOUR WORKED?
I make $167.42 of Net of W2 per Hour for every hour spent working for my clients. We refer to this as “Effective Hourly Rate” (EHR).
But which “line of business” (Fully Managed, T&M, Projects, Product sales, etc.) is actually generating most of my profit? I can request the report to show information broken-down by the Line of Business using the ‘Lines of Business’ drop-down menu just above the table. I select the Line(s) of Business I want to see, then click the ‘refresh’ hyperlink just above the table. Each Line of Business is ‘color-coded’ for easy reference:
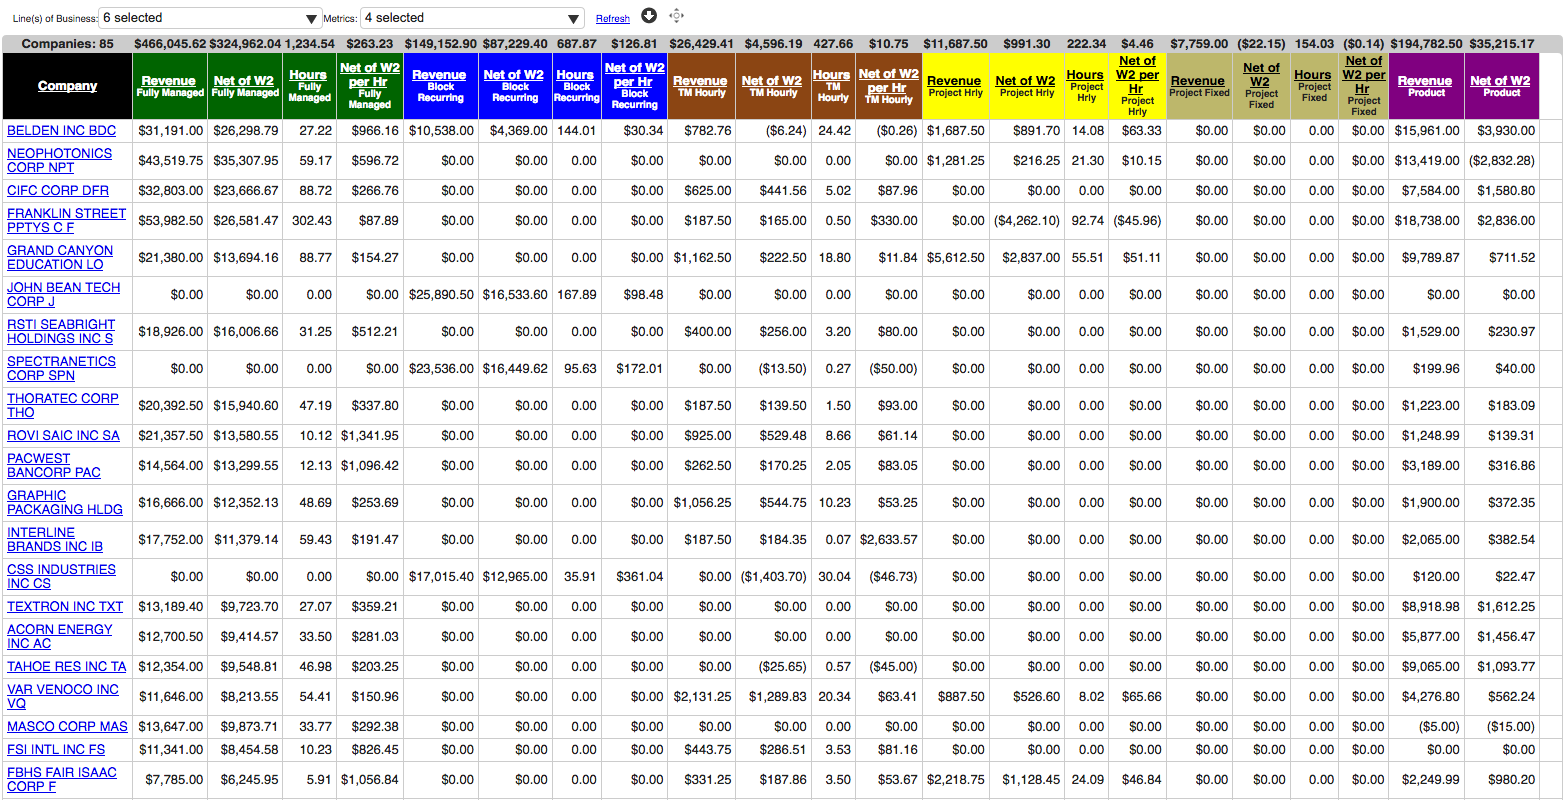
Show by Line of Business
(Fully Managed, Block, T&M, Projects (Hourly and Fixed) as well as Product sales. )
(Click image for larger view).
- FULLY MANAGED: $324k profit at $263.23 per hour
- RECURRING BLOCK: $87k profit at $126.81 per hour
- HOURLY TIME-AND-MATERIALS: $4,596 profit at $10.75 per hour
- HOURLY PROJECTS: $991 profit at $4.46 per hour
- FIXED-FEE PROJECTS:$22.15 loss at 14 cents loss per hour
- HARDWARE/SOFTWARE SALES: $35k profit
PURPOSE
The purpose of the Profitability by Client report is to allow you to understand which of your clients are most profitable over the timeframe that you have selected, as well as to give you a measure of overall profitability across your entire client base.
WHY IS THIS IMPORTANT?
It is important to know which clients are generating the most profit so that you can protect and even deepen the relationship with those clients. Conversely, it is important to also know those clients that are generating the LEAST amount of profit, so that you can restructure the terms of the business arrangement with those clients, including perhaps terminating that relationship for your least profitable clients.